The equity market internals, as measured with our multi-factor model, have significantly improved off the October 27 lows.
We now have 31% of the constituents of the S&P 1500 with a bullish model score vs. 18% back then. The number of stocks with a negative, but in most cases improving model score now stands at 60% vs. 78% back then.
The model works off a weekly timeframe, so it is slow-moving and less susceptible to whipsaws when viewed within a daily timeframe. See charts of major indices below.
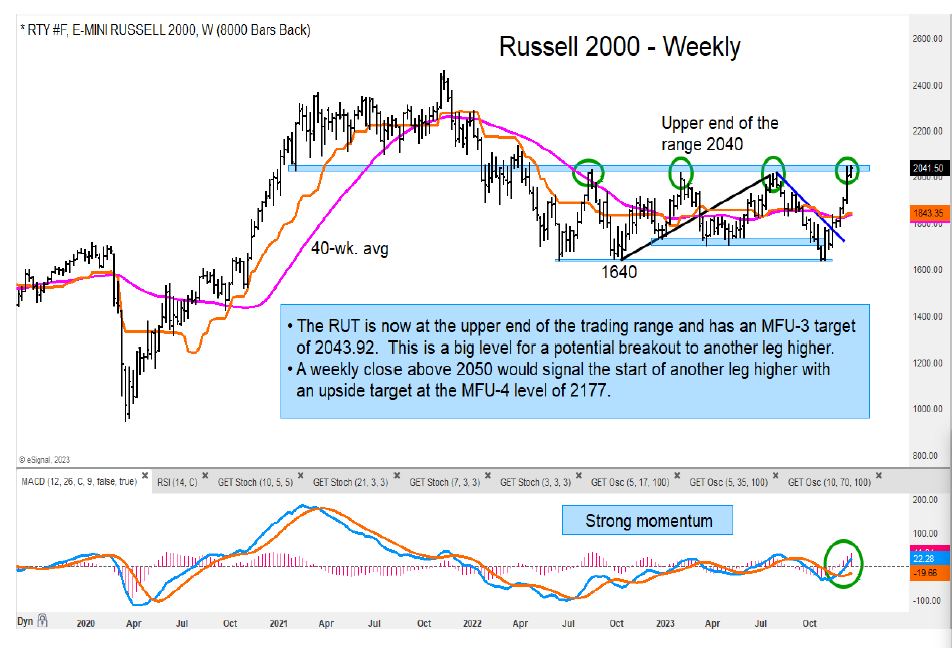
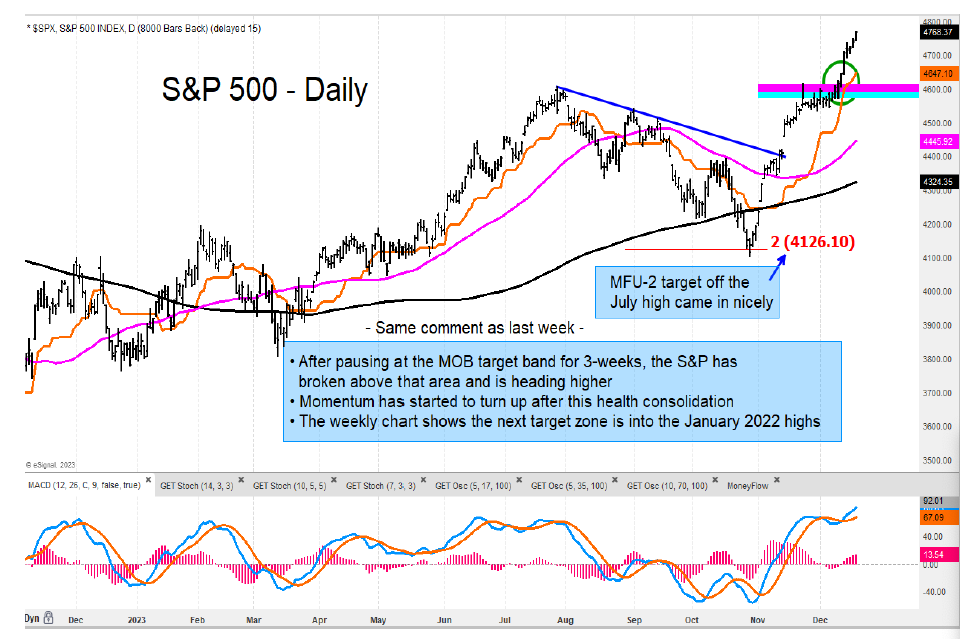
The major U.S. indices are beginning to look very favorable. The Russell 2000 has made its way to the upper end of the trading range we have been highlighting for some time. This is a major inflection point where a break above this zone would lead to another significant move higher.
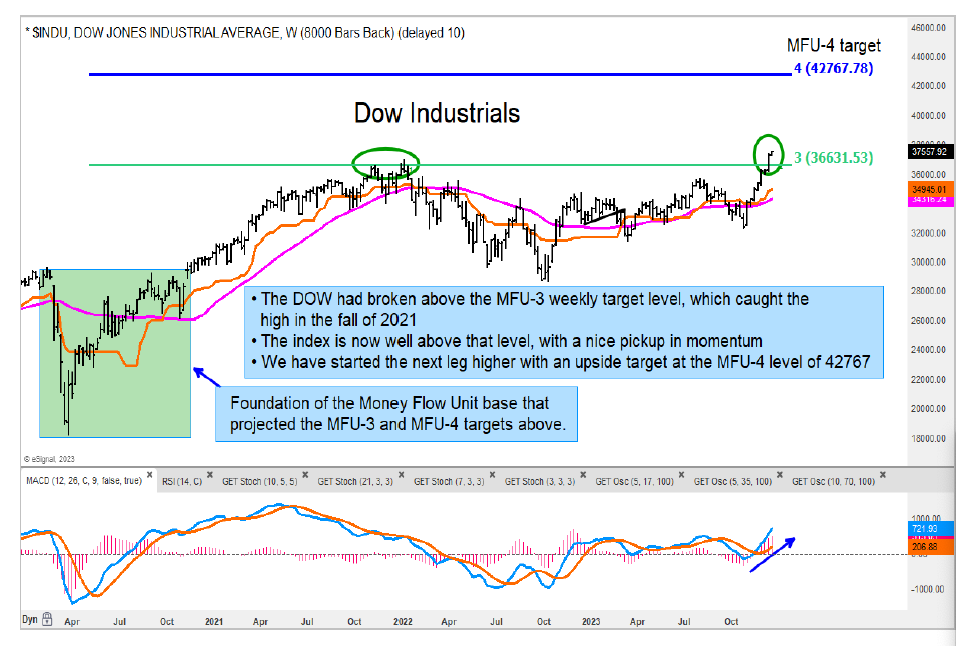
The Dow Jones Industrials had recently advanced above an important area of the MFU-3 target level of 36631. Our expectation is that this is the start of another leg higher which should take the index to the 42767 area.
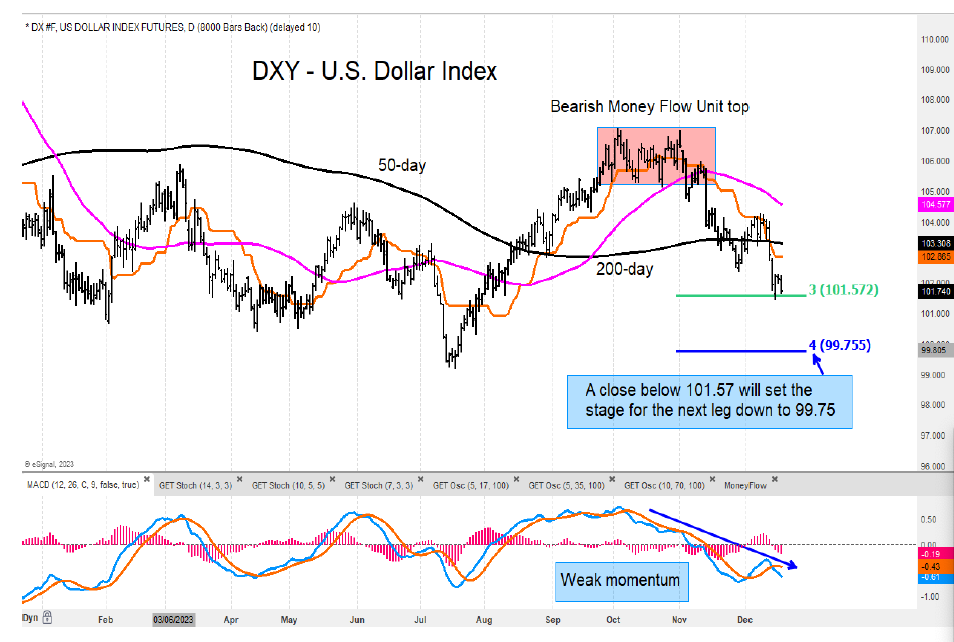
Elsewhere, the U.S. Dollar Index (DXY) has been in a weak trend lower and looks poised for another leg down.
Twitter: @GuyCerundolo
The author or his firm have a position in mentioned securities at the time of publication. Any opinions expressed herein are solely those of the author, and do not in any way represent the views or opinions of any other person or entity.


