“Mm Mm Good” – But stock market valuations are getting very expensive as the hunt for yield heats up…
No U.S. bond trader under the age of 56 has traded in a prolonged bear market. That striking fact is a function of steadily falling bond yields since 1981. Over this era, investors have been increasingly mesmerized into trusting that yields may never go materially higher. That belief seems stronger than ever in the U.S. as yields are dropping to levels not seen at any point in American history (since at least 1790). In the U.S., one can still find Treasury bonds with a positive yield but globally over $13 trillion of sovereign bonds have negative yields. The poster child for this insanity is a 50-year Swiss sovereign bond which yields negative .023%. Try to make sense of intentionally investing your money for 50 years with the guarantee of losing money.
As described in prior articles, when yields are lower than appropriate, capital gets mis-allocated. The result is economic distortions closely followed by hostile economic and financial consequences. This article offers two examples intended to highlight market distortions resulting from abnormally low interest rates. the subsequent hunt for yield by investors has driven stock market valuations to extremes.
The Hunt for Yield
With “risk free” U.S. Treasury bonds and other relatively safe investment-grade bonds offering yields in the low single digits, “conservative” investors are struggling to find investments that provide decent credit quality and respectable returns. The result of this quest for yield has been a mad rush by investors into dividend yielding stocks.
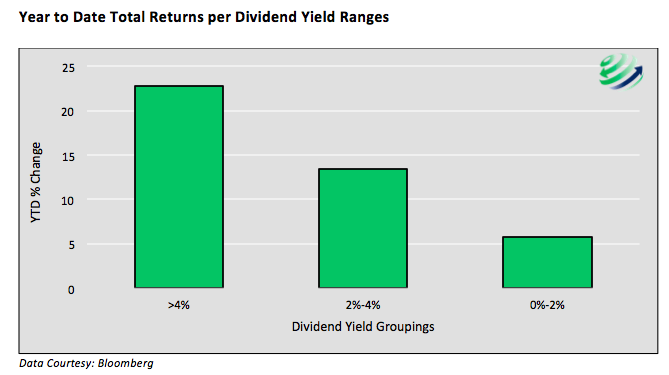
The following two graphs highlight how those stocks with the highest dividend yields are clearly most in demand this year. The first graph below plots the average, non-weighted, year-to-date returns for the stock of each S&P 500 (INDEXSP:.INX) company, categorized by their respective dividend yield ranges.
The following scatter plot shows the S&P 500 by sector, highlighting how sectors with the highest dividend yields are also the best performing.
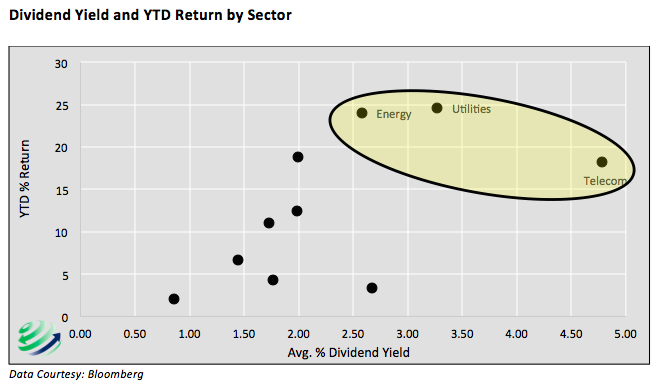
The data in both graphs strongly suggest that in 2016 equity investors have a strong preference for companies and sectors with higher dividend yields.
Campbell’s Soup
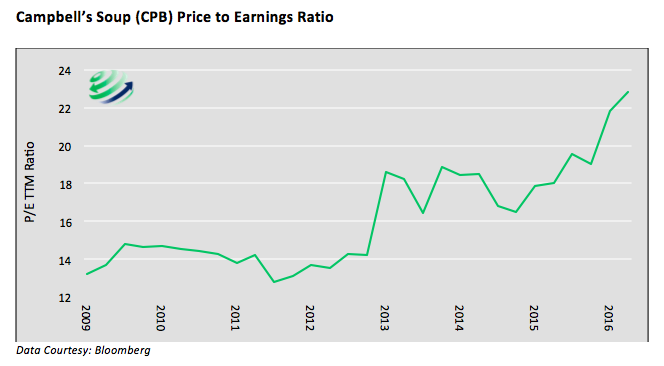
Campbell’s Soup (CPB) provides great insight into this phenomenon. CPB currently trades at a Price to Earnings ratio (P/E) of 23. As shown in the graph below its P/E has spiked over the last two years and stands at a 50% premium to its average since the 2008 recession. Over the course of just the last 7 months, CPB’s stock price has risen 25% while earnings remain flat. As a result the dividend yield was reduced from a somewhat respectable 2.50% dividend to 2.00% currently.
Investor demand for CPB appears to be a function of investor appetite for yield. We deduce this because CPB is not a growth company. Since 1991 its annualized revenue growth has been 0.97%. In the last 5 and 10 years revenue growth has slowed to 0.63% and 0.82% respectively.
This concept of a no-growth soup company with soaring valuations is alarming. The price of CPB would have to drop 30% to return to its post-recession average P/E. If that were to occur, it would take 16 years’ worth of dividend payments to recoup the price loss, assuming dividends remain stable!
Utility Stocks
Utility stocks offer another poignant case study. These providers of electric, gas, sewage and water services are well known for higher relative dividends, low revenue growth and reduced price volatility. Year to date, the popular ETF representing utility stocks (XLU) has risen 20%, and in the process its dividend yield dropped from 3.70% to 3.00%.
Not only are current investors of utilities receiving a lower dividend yield, but they are paying an extremely high valuation in order to earn 3.00%. Consider the graphs below showing the Price to Sales ratio and the Price to EBITDA ratio for the utility sector.
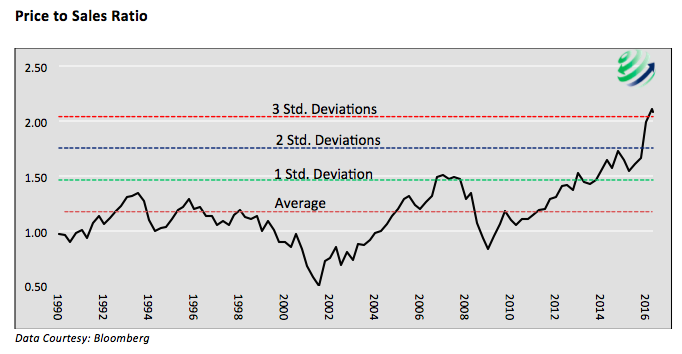
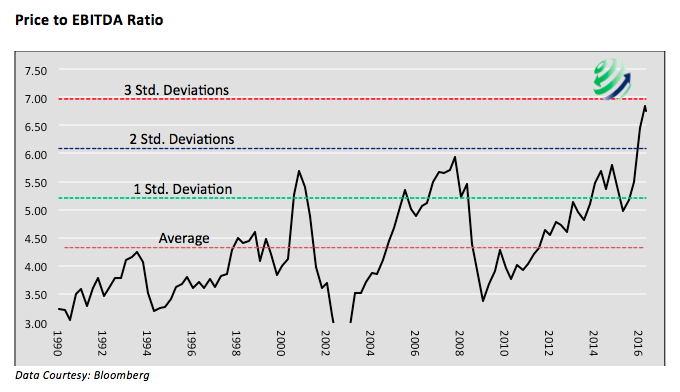
As the graphs show, the Utility index now trades at valuations that are at or near three standard deviations away from the average. Both readings dwarf any prior level since at least 1990. As is the case with CPB, these valuation anomalies are a function of investors demand for yield and not the potential growth of the underlying companies. In fact, revenue growth in the utility sector is worse than that of CPB. Revenue per share has declined in each of the last eight quarters and is currently the lowest in over a decade.
The Bottom Line
The bottom line as shown through two examples, is that insatiable demand for stocks with above average dividends is forcing stock market valuations to diverge significantly from historical norms. Investors buying the equity of these and many other companies with high dividend yields are seeking the perceived safety of dividends and reduced price volatility. However, in our opinion, what many of these investors will receive is low absolute dividends and more price risk. Beta driven strategies, and some so-called “smart beta” portfolios, may be in for a rude awakening if, as we suspect, many of these safe dividend stocks exhibit a larger draw down than their historical betas would predict.
The valuations of many companies providing higher dividend yields have changed drastically in a relatively short time period. This is not an imminent warning to sell but an alert to monitor stock market valuations and not just dividend yields. The hunt for yield could easily persist driving prices even higher, but do not lose sight of underlying valuations. At some point, as is true throughout the history of financial markets, regression to the mean will occur.
Summary
Negative and zero interest rate policies are creating significant distortions across the global economy and financial markets. The examples in this article are just two of many instances. For those who say that we should not worry about the current state of monetary policy, this article provides further evidence of the distortions these aggressive monetary actions create and makes the reader aware of the wealth destruction that will eventually occur as a result.
Thanks for reading.
Twitter: @michaellebowitz
Any opinions expressed herein are solely those of the author, and do not in any way represent the views or opinions of any other person or entity.


: Showing Some Signs of Emerging Strength")
