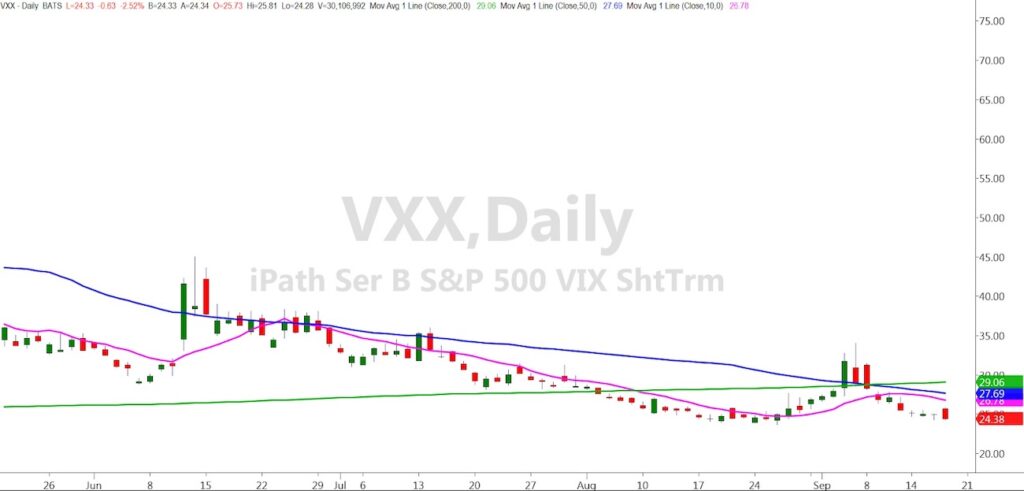
Yesterday, we were watching the VXX to gauge fear in the market.
Today it gapped higher and then continued to sell off while the indices gapped lower and began to rise.
Now the QQQs, DIA, and SPY while selling off from the highs, had some end of day buying come back which pushed them higher while the VXX sank further.
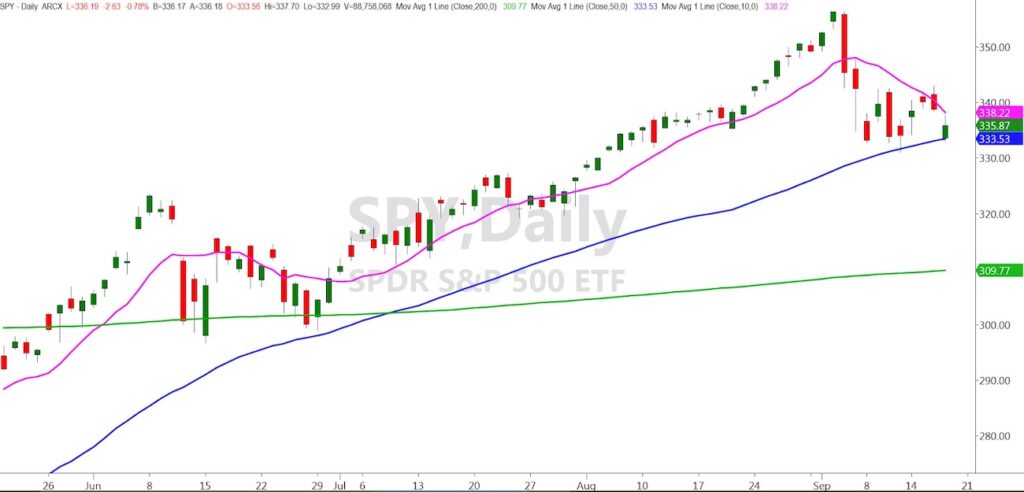
One bearish sign is that today the SPY did not fill the gap. To close it, the SPY would need to have traded past yesterday’s low of 338.52. It only traded up to 337.70
While this is not enough to give us any clear bias, we do have an obvious break in the QQQs, which could be more convincing.
Once again, let’s check back to our outliers LQD and JNK, to give us a better idea of what is happening.
LQD did not break yesterday’s low and closed basically unchanged.
While LQD didn’t give us any major decisive action, JNK on the other hand had a green day closing over both the 50 and 10-DMAs.
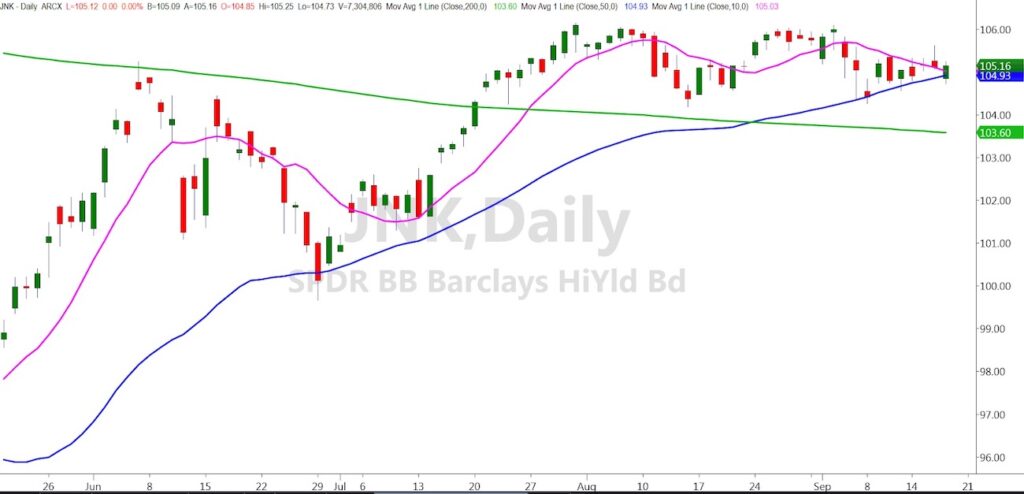
This is telling me, while pieces of the puzzle could potentially breakdown, we still have underlying support in the market.
By whom?
Well the Fed of course, and they will continue to help as much as they can. Especially with the ever-nearing election.
We can also note that the QQQs closed above the September 11th low of and its recent break in the 50-DMA at 266.90.
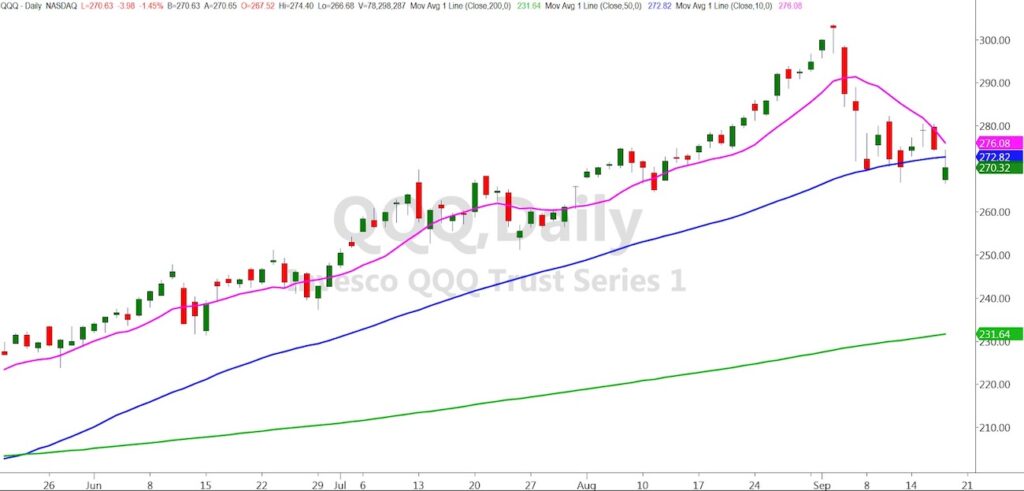
Tomorrow, we can then look for a break of that low and a confirmation into a caution phase or a potential rally back to the 50-DMA and above.
If neither of those happen, I would look for it to begin building support in the current trading range.
With the market at an inflection point, keep these levels in mind for tomorrow so our trading decisions have us on the right side of the market.
S&P 500 (SPY) New Support 333 Resistance 338
Russell 2000 (IWM) 151 50-DMA Support Resistance 156
Dow Jones Industrial Average (DIA) 280 pivotal support 285 resistance
Nasdaq (QQQ) Major Support 260-267. Resistance 274-275
KRE (Regional Banks) Needs to hold 36 Support. Looking for a move over 50 and 10 DMA
SMH (Semiconductors) Broke but close over 50-DMA 164 Support. 169 pivotal
IYT (Transportation) 200 key support
IBB (Biotechnology) Needs to close back over 50-DMA
XRT (Retail) 49.30 the 50-DMA is key support
Twitter: @marketminute
The author may have a position in the mentioned securities at the time of publication. Any opinions expressed herein are solely those of the author, and do not in any way represent the views or opinions of any other person or entity.


