With the S&P 500 (NYSEARCA: SPY) within a stone’s throw of finally reaching January’s all-time-high up at 2,872.87, and the other major U.S. indices even closer to their respective highs, one might assume that the rest of the world’s equity markets would also be close to another celebration.
As I talked about last week, that couldn’t be further from the truth.
Disconnects like this can be a warning sign if you are on the perma bear side of the fence as they throw cautionary shots at the market following every headline.
These disconnects can also equal opportunity if one has a level head and does not get sucked in by the media propelled scary headline of the week. There is something called reversion to the mean and it seems like the underperformance, both on an absolute and relative basis has become pretty severe in the battered Emerging Markets (NYSEARCA: EEM) area.
In recent commentaries about overseas markets, our conclusion was that the majority of weakness was concentrated in Asia, and we assume a big part of that had to be due to the ongoing trade war talk. We also concluded that a rising U.S. Dollar Index (USD) has also hurt overseas markets, especially emerging markets.
The EEM ETF is heavily weighted toward Asia with China (NYSEARCA: FXI) representing almost 31%, South Korea (EWY) making up over 14%, and Taiwan (EWT) 12% for a total of 57%. India (INDA) is over 9%, Brazil (EWZ) over 6%, and South Africa (EZA) around 6%. These six countries make up 79% of the ETF. So as goes Asia, and as goes the U.S. Dollar Index, so goes EEM. And it hasn’t been a pretty picture.
Since the January 26th closing high to yesterday’s closing low, Emerging Markets (EEM) has cratered 19.8% while the S&P 500 is within 1% of its January high. Yet, since their respective 2016 lows, EEM is up about 54%, despite its recent mini bear market, while the “500” has advanced 55%.
Going back to their respective bear market lows (EEM bottomed in November 2008 while we bottomed in March 2009), the S&P 500 has rallied 320% while EEM is up only 180%. It’s all about how you slice the data.
From a relative strength perspective, the “500” has outperformed EEM since October 2010. That outperformance was pretty steady until early 2016 when emerging markets equaled the U.S. During the period from 2003 to 2007, when EEM went parabolic, there was huge outperformance overseas. From the secondary low in March 2003 to the October 2007 high, EEM soared 425% while the “500” ran up “only” 96%.
The key takeaways here are that it is not uncommon for one equity market to not only outperform another for a long period of time, but by a huge percentage. Obviously, the variability of returns is much higher with emerging markets than it is with the U.S. and considering reversion to the mean, this creates major opportunities from a long and short perspective as well as from a hedging perspective. Is it time for some emerging market outperformance or at least some performance other than to the downside?
On the daily chart, there are some potential positives for EEM. First, it’s possible that price has traced out what I have coined a “fish hook” bottom. This pattern, which I have seen on many charts (both intraday and daily), many times marks a key low. Second, it’s possible that the latest free fall since the end of July marked some type of capitulatory bottom. Third, if EEM can get back over the 42.50 zone, we may also have a false breakdown.
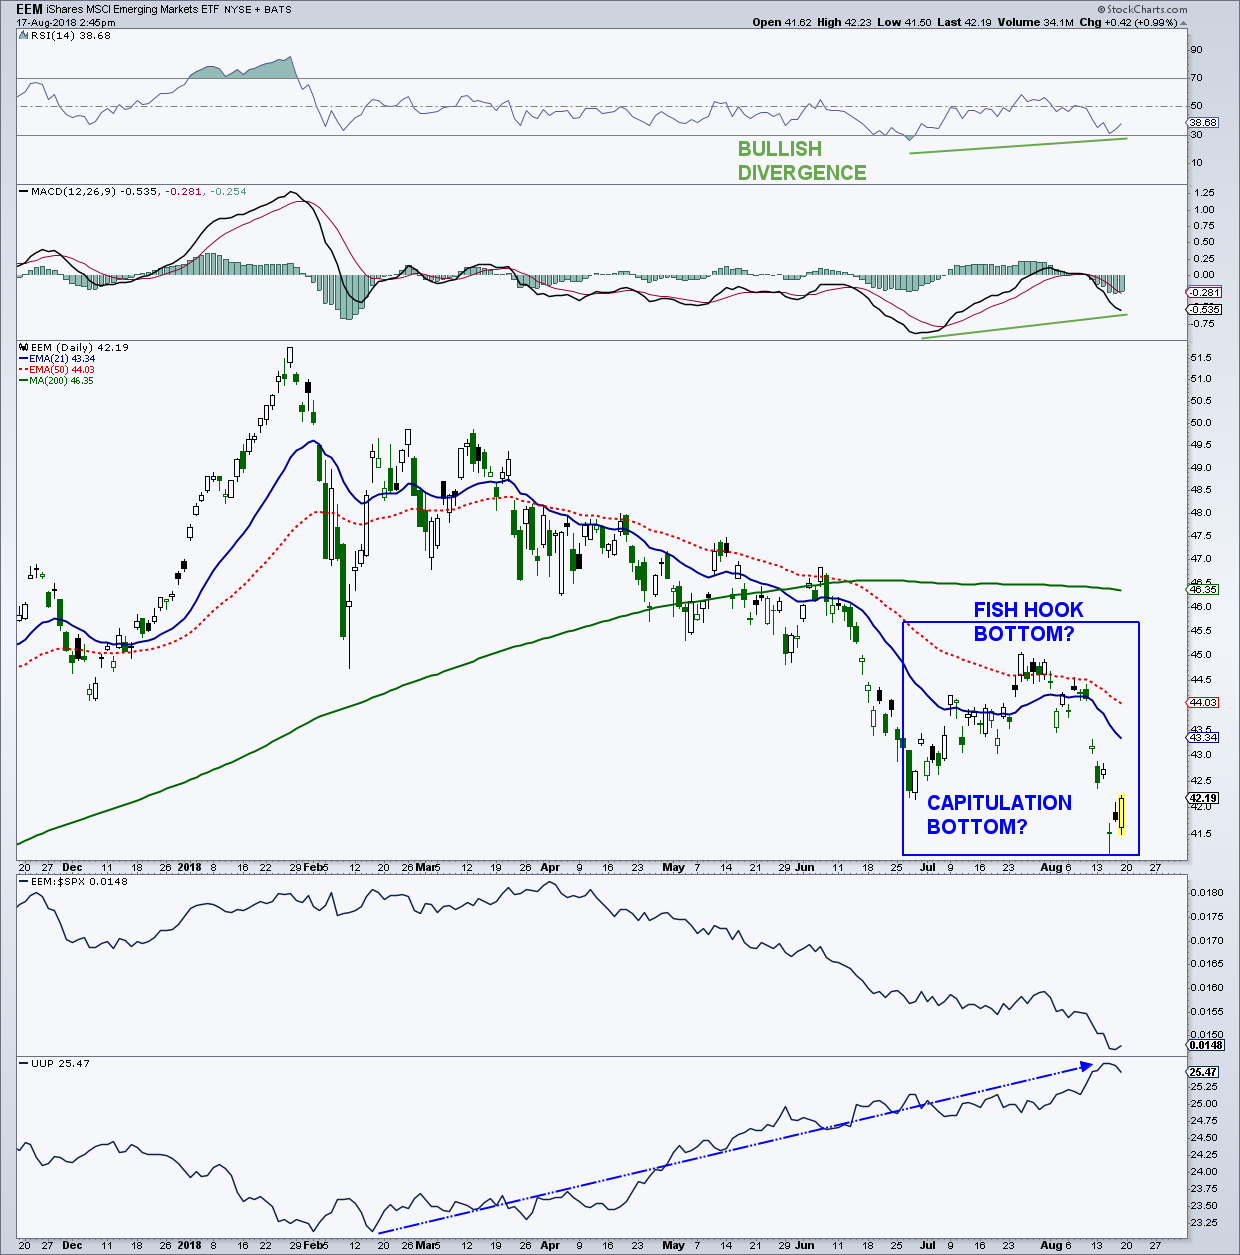
Fourth, there was a very nice bullish momentum divergence at the latest closing low yesterday from both the 14-day RSI and the daily MACD. Fifth, and since the January 26th high, it’s possible that we saw a completed five wave decline and we could at least see some type of counter trend rally. And sixth, as already talked about, the dispersion of returns between the U.S. and emerging markets since January is huge so any mean reversion (bottom fishing) could help the cause.
On the weekly chart, the first thing that jumps off the chart is that EEM has fallen to an absolute huge area of chart support in the 39 to 43 region. EEM traded sideways from 2010 until 2015, peaking many times between the 39 and 43 area. This very wide structure should, in our opinion, hold the current decline at bay.
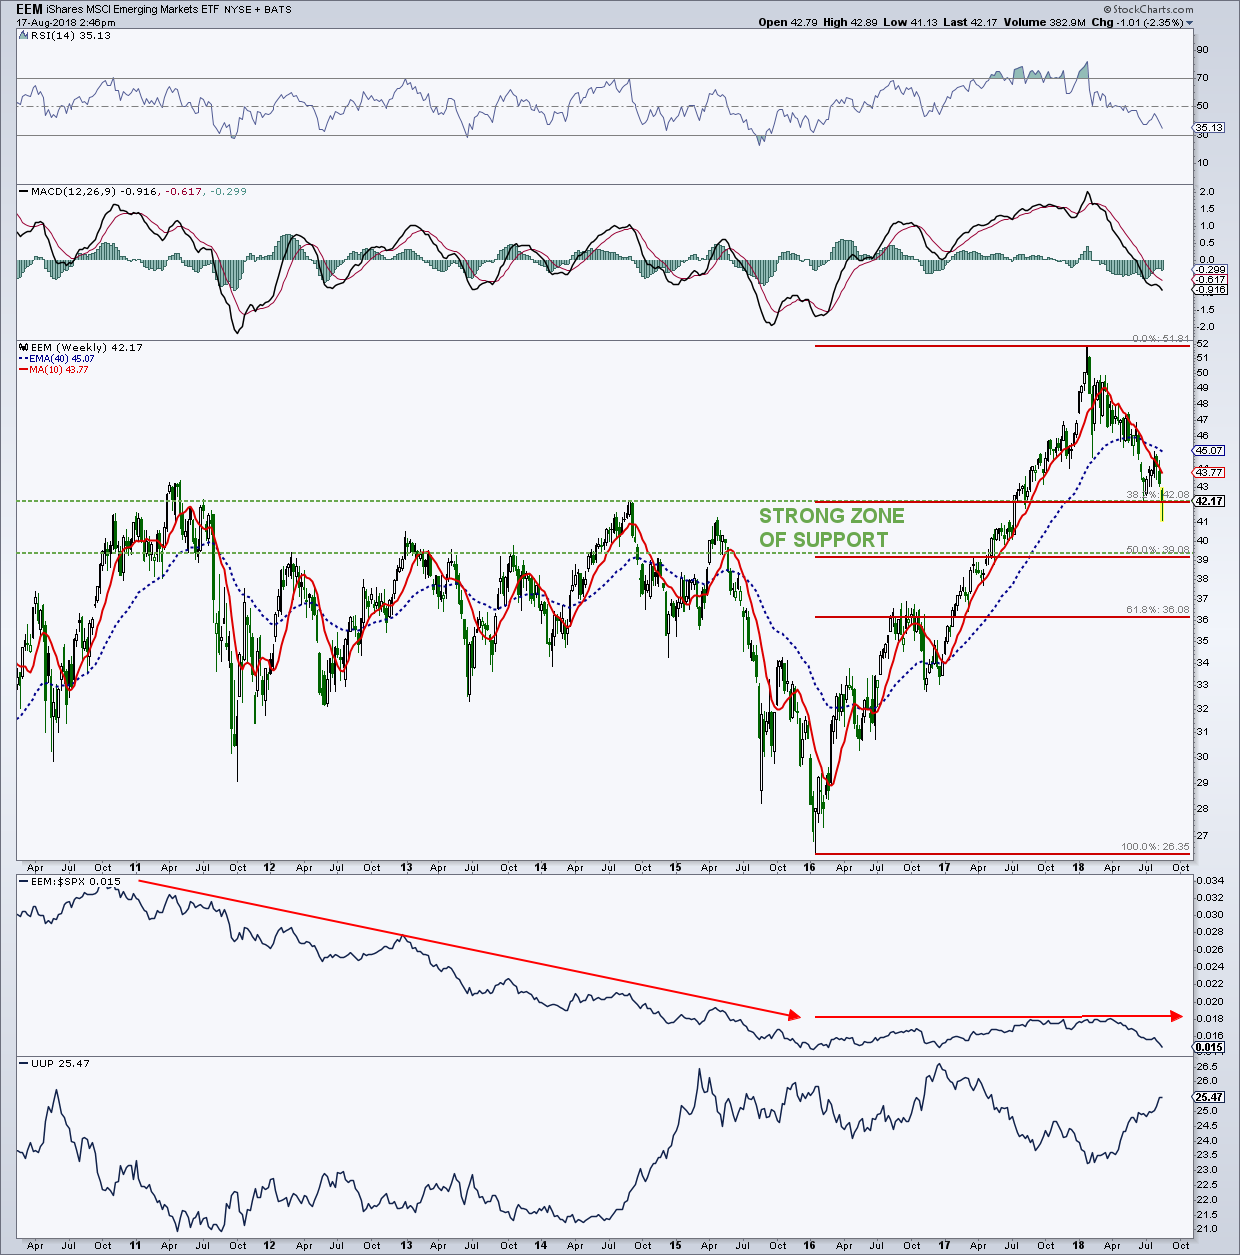
Weekly momentum has not quite cycled into oversold territory, but it is close enough with the 14-week RSI down in the 34 zone. Weekly MACD is heading lower below the zero line, a concern. If price can start heading north, I would like to see the 14-week RSI get back above the 50 level and see the weekly MACD turn higher and recapture the zero line, but that’s a ways down the road.
EEM market sentiment is showing extreme pessimism, certainly a condition for an intermediate-term bottom. The same can be said about the sentiment towards the three major components of EEM, the China, South Korean and Taiwan stock markets. For the most part, fund flows have been negative for emerging markets in recent months, another sign of fear in the marketplace.
While we are not fundamental in nature here, our position was that the trade wars, like every other worry since 2009, would blow over and get resolved. I’m not hearing much about Turkey today. The other issue for EEM is the U.S. Dollar Index ($USD). As I said recently, hedge funds are highly exposed to the greenback, a potential warning. The COT data has turned more bearish as the dollar has rallied, but is not at the extremes that we saw in late 2016 at the last dollar peak. Sentiment toward the dollar is at an optimistic extreme, but can get more lopsided. The latest push higher by $USD was not confirmed by daily momentum, another warning that we could see some relief here.
This was sent to On The Mark subscribers Thursday afternoon.
Feel free to reach out to me at arbetermark@gmail.com for inquiries about my newsletter “On The Mark”. Thanks for reading.
Twitter: @MarkArbeter
The author has a long position in Platinum at the time of publication. Any opinions expressed herein are solely those of the author, and do not in any way represent the views or opinions of any other person or entity.


