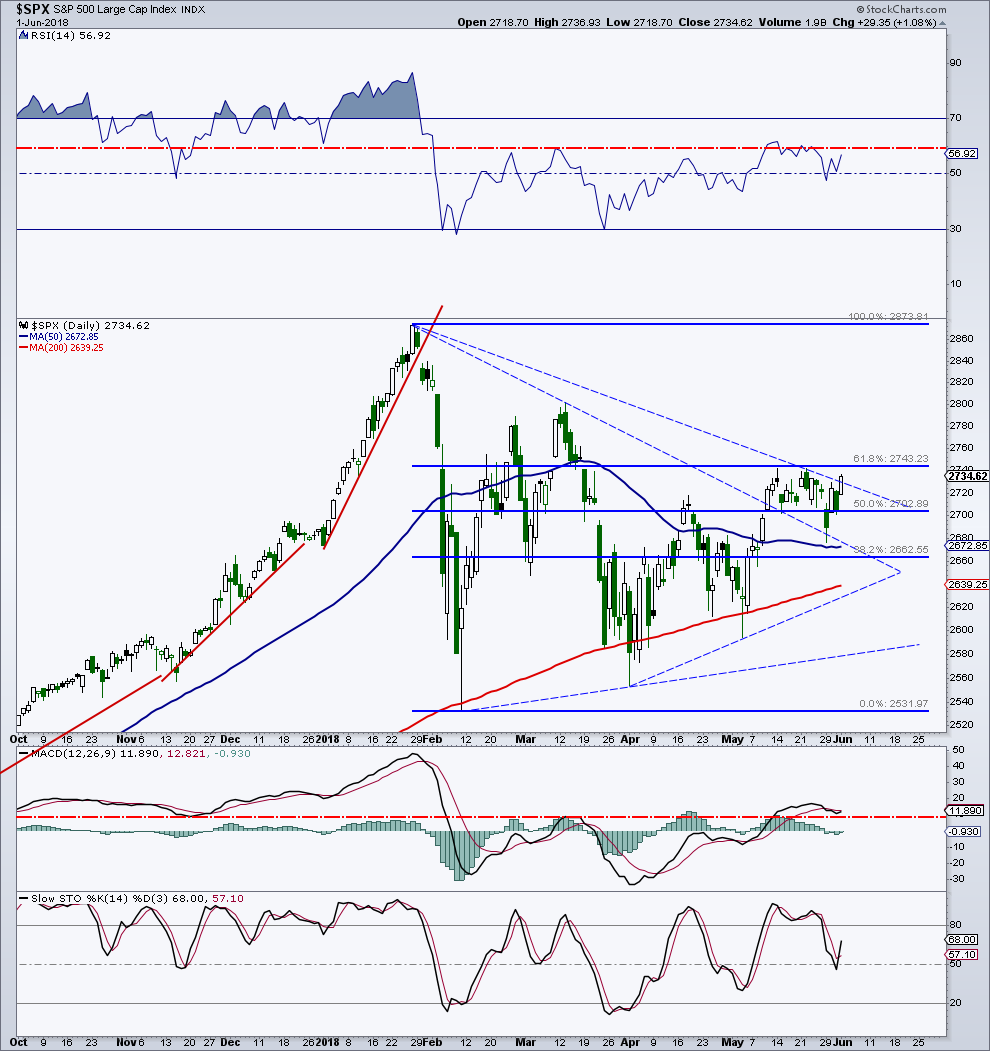
The S&P 500 is attempting to breakout of a bullish flag pattern.
This is certainly a positive after the rocky price action investors saw early last week.
If the broad stock index can retake its recent high and 61.8% retracement level at 2,743, we could see at least a move back toward the March high of 2,802. That also represents the next Fibonacci retracement of 78.6% of the entire decline. See chart below.
I’m still looking for that consistent and sustainable uptrend to develop to confirm that this very lengthy consolidation is over.
S&P 500 Index – Breaking out?
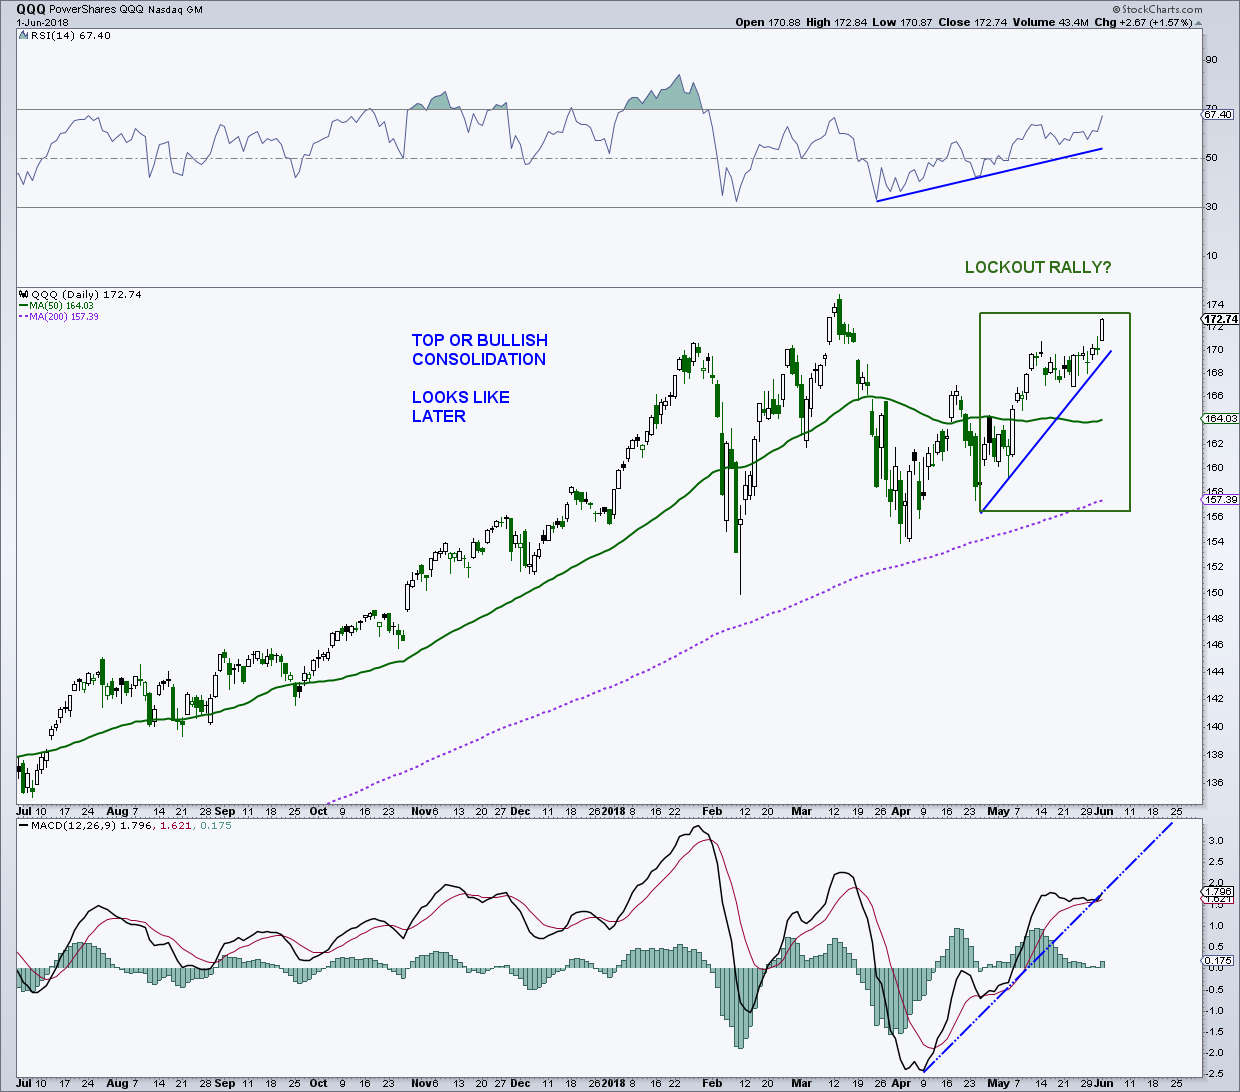
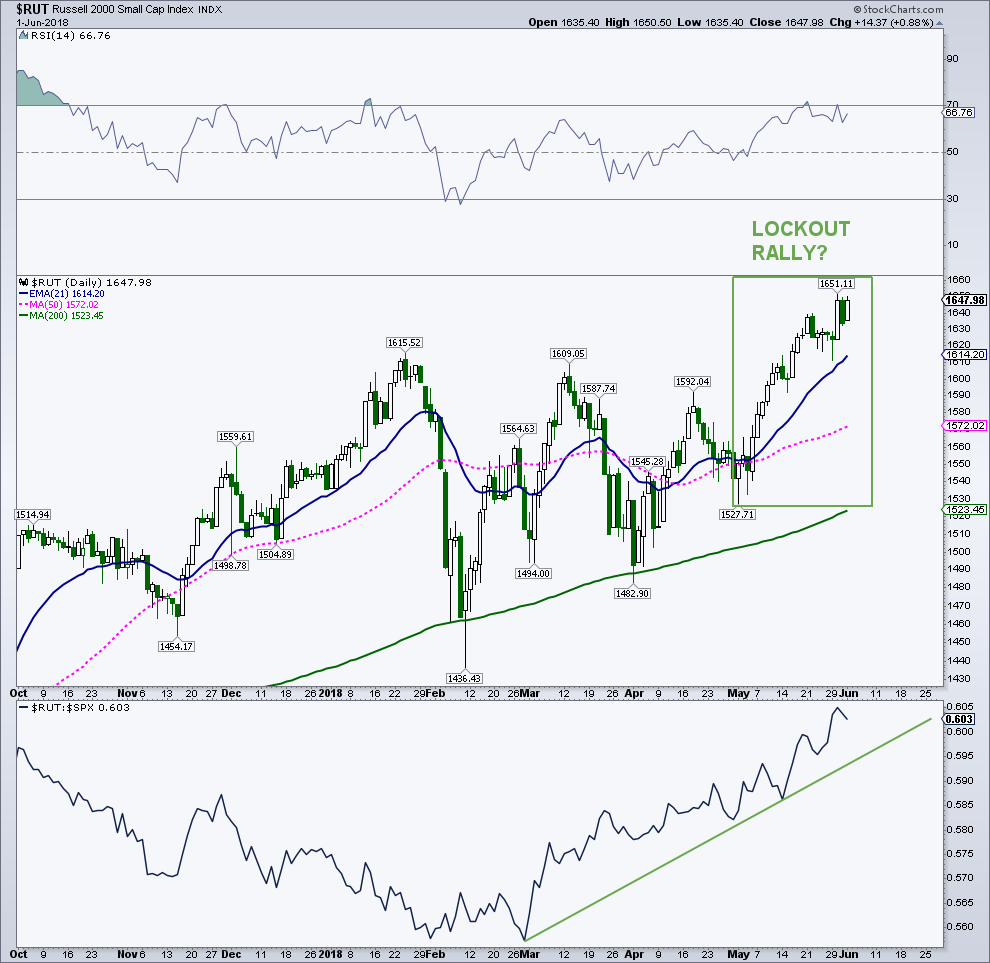
Looking at both the QQQ’s and the Russell 2000, it’s very possible that these indices are seeing the beginnings of the lockout rally sorely missing on the “500.” Lockout rallies are extremely common when the market is coming out of an intermediate- or long-term decline.
The QQQ’s, at one time not long ago, looked to be tracing out a “potential” H&S top, similar to the SOX. This bearish formation has failed and it looks like just a bullish consolidation. In the past, when potentially bearish patterns never complete and then turn positive, it is generally pretty bullish (“500” H&S in 2010).
PowerShares QQQ (Nasdaq 100 ETF)
Russell 2000 Small Cap Index
Feel free to reach out to me at arbetermark@gmail.com for inquiries about my newsletter “On The Mark”. Thanks for reading.
Twitter: @MarkArbeter
The author may have a position in mentioned securities at the time of publication. Any opinions expressed herein are solely those of the author, and do not in any way represent the views or opinions of any other person or entity.


