The Big Picture
It’s been a couple weeks since my last weekly outlook here – glad to be back. Investors are operating in a climate that is prone to volatility so we must remain focused on our stock and stock market trends within our given timeframes.
Stocks are attempting a recovery rally to start the week. There is still plenty of “noise” out there as bulls vs bears continue to chatter. As traders we need to follow the price action (and trend indicators) and steer clear of noise and opinions.
Below is my weekly trading update and stock market trends outlook. Let’s start by looking at a chart of the S&P 500 ETF (SPY).
S&P 500 Chart – Week 15 (week of April 9)
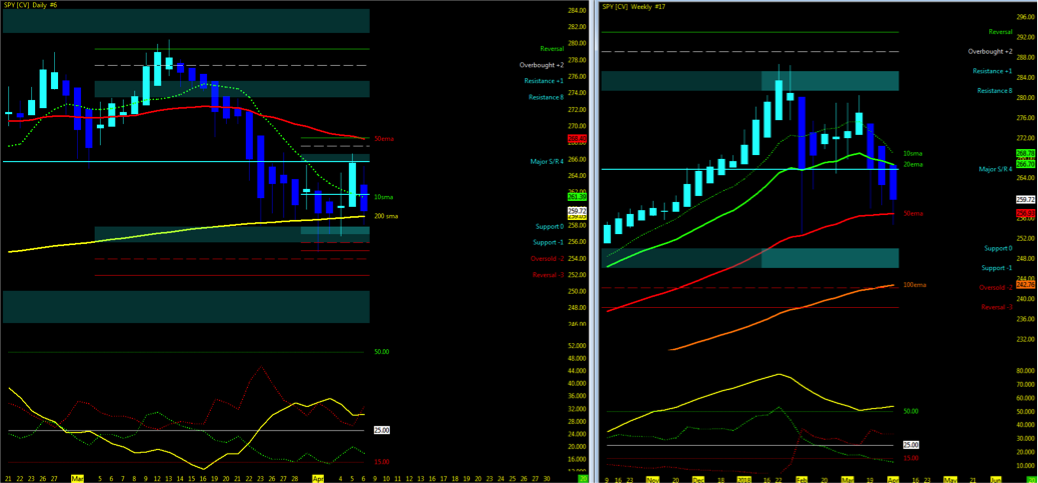
Attempting to determine which way a market will go on any given day is merely a guess in which some will get it right and some will get it wrong. Being prepared in either direction intraday for the strongest probable trend is by plotting your longer term charts and utilizing an indicator of choice on the lower time frame to identify the setup and remaining in the trade that much longer. Any chart posted here is merely a snapshot of current technical momentum and not indicative of where price may lead forward.
Current Technical Trend…
- Check out my Week 14 recap and trend charts
- VIX levels above 20 as momentum consolidates. That may ease this week.
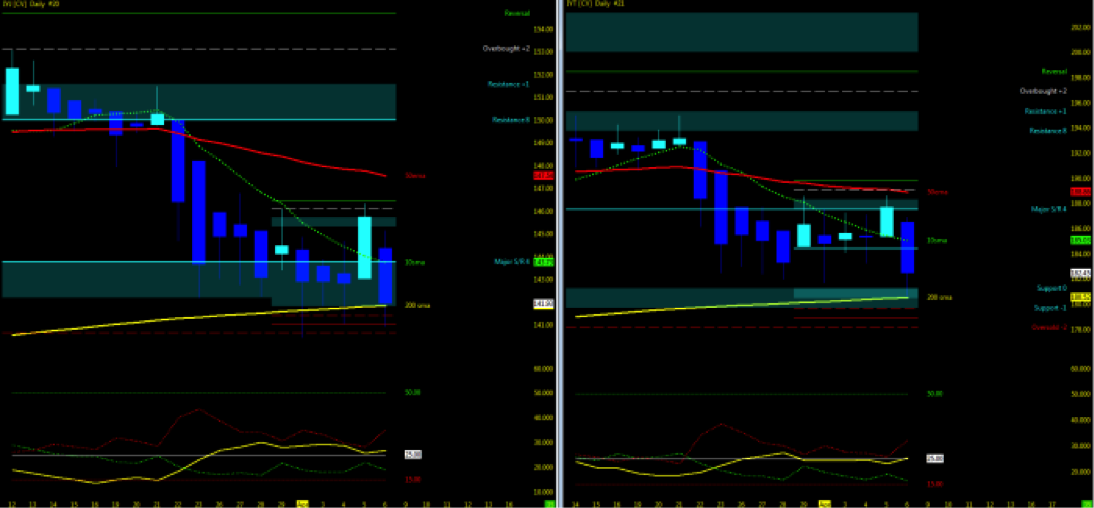
- Industrials/Transports
- Monitor for the two ETF indices to remain in sync as supporting indicator of momentum (Up or Down)
- Momentum downside BUT holding at 200 moving average. This may bring a bounce.
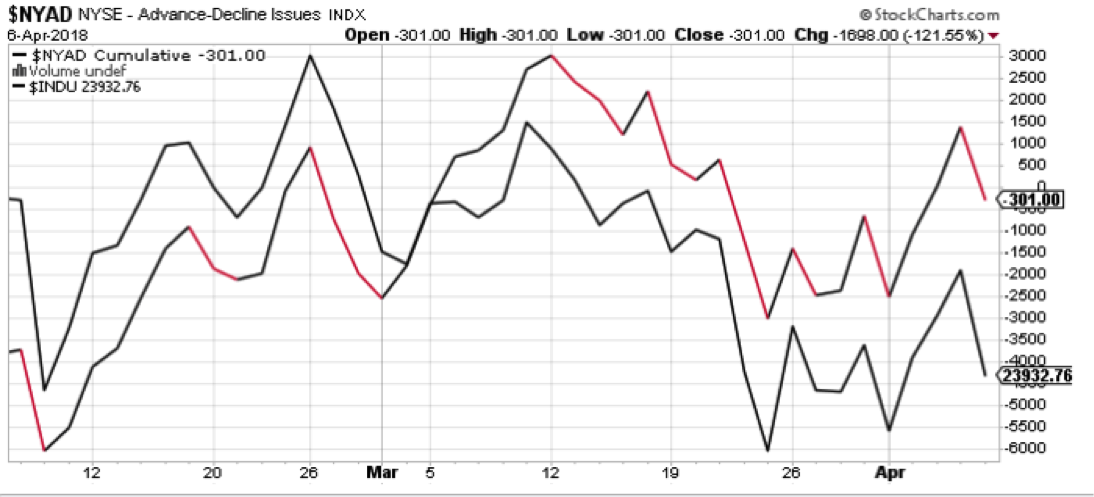
NYSE Advances-Decline Line and Dow Jones Industrial Average are trading in sync. Watch for next move.
Stock market indices trading at 200 period moving averages with open gaps both above/below.
The Bottom Line
After a brief hiatus I am back in the drivers seat. As the markets migrate and settle in, consolidation may take place at the 200 period moving averages.
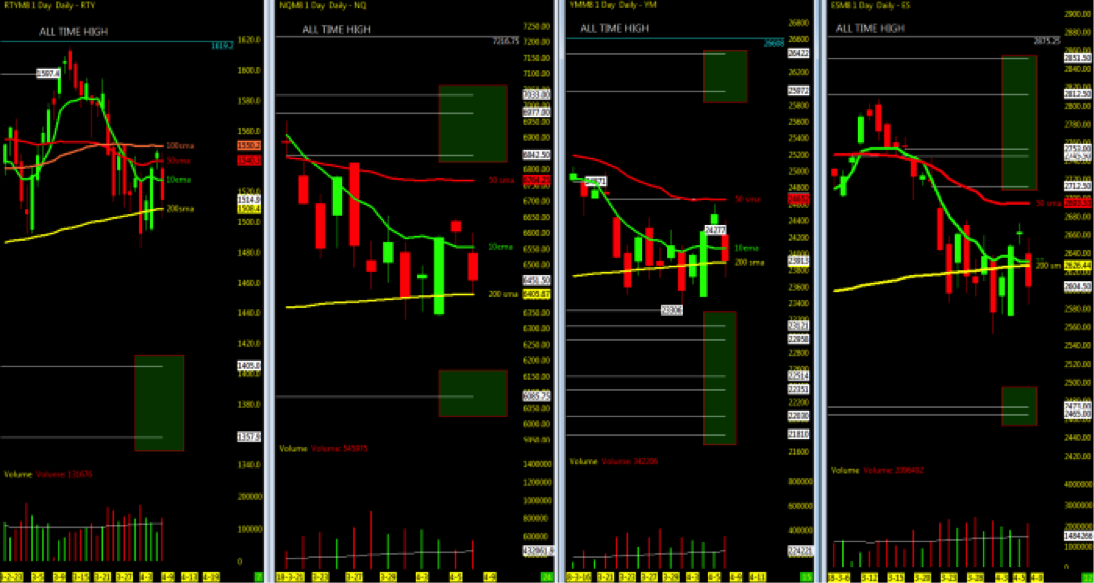
After an established uptrend run that came back to test the 200 day moving average, the Nasdaq lifted back to the highs while the S&P 500 and Dow Jones Industrial Average remained more reserved that were unable to maintain momentum above the 10 or 50 period moving averages. The S&P 500 futures (ES) momentarily regained its 50 ma but wasn’t able to cross and hold above it. This lead to the latest market pullback and retest of the 200 day ma.
So I see two scenarios playing out. There is NO QUESTION, the market is in correction and the momentum can tip the scales in either direction. Do the big banks (reporting this Friday) hold the market up or does the plug get pulled and we start closing out downside open gaps under the 200ma.
From the economic stage, earnings season is once again upon us which can impact. Trade tariffs perhaps and FOMC rate hikes surely can play a role for the mid-term. But neither of these as a technical observer effects the daily momentum. Sure, intraday we are ready in both directions but the bigger weekly question I look for is where is the market pulse and what is the probability that we maintain the current position or initiate a selloff or back upside.
Technically, my ETF charts that symbolize market momentum clearly paints a picture of momentum building to the downside in this short term pullback of the bigger pic Uptrend. The 200ma is a big line to watch and must be respected for it’s support of price action holding above. As long as we stay above it, technical momentum will hold in the bigger picture and breakout of consolidation will be the key to market direction. I don’t claim to have a crystal ball insight and by simply watching the charts tells me all. The ADX which I have been monitoring over the last several weeks on my charts also backs up my technical perspective of downtrend momentum that is flat-lined in consolidation. Weekly Heikin Ashi Doji bars, don’t make it any easier.
Keep your eyes on the 200ma. Watch for the 10ema to go under the 200ma and if 200>50>10>PRICE, we have ourselves a deeper correction coming. Till then, patience is the game in this market uptrend that has just as much probability in either direction.
Big Picture Market Pulse: Consolidation at the key moving averages as they are out of sync. ADX momentum downside on Indices as VIX volatility remains strong to the upside.
Thanks for reading and remember to always use a stop at/around key technical trend levels.
Twitter: @TradingFibz
The author trades futures intraday and may have a position in the mentioned securities at the time of publication. Any opinions expressed herein are solely those of the author, and do not in any way represent the views or opinions of any other person or entity.


