Investors are still operating in a climate that is prone to volatility so it pays to stay focused on stock market trends within your given timeframe.
Stocks have recovered sharply but there is still plenty of “noise” due to market crosscurrents and bull vs bear chatter. Traders need to follow the price action (and trend indicators) and steer clear of noise and opinions. If the market correction/consolidation continues, your process (and stops and limits) should offer you new looks on both the long & short side of trades.
Below is my weekly trading update and stock market trends outlook. Let’s start by looking at a chart of the S&P 500 ETF (SPY).
S&P 500 Chart – Week 12 (week of March 19)
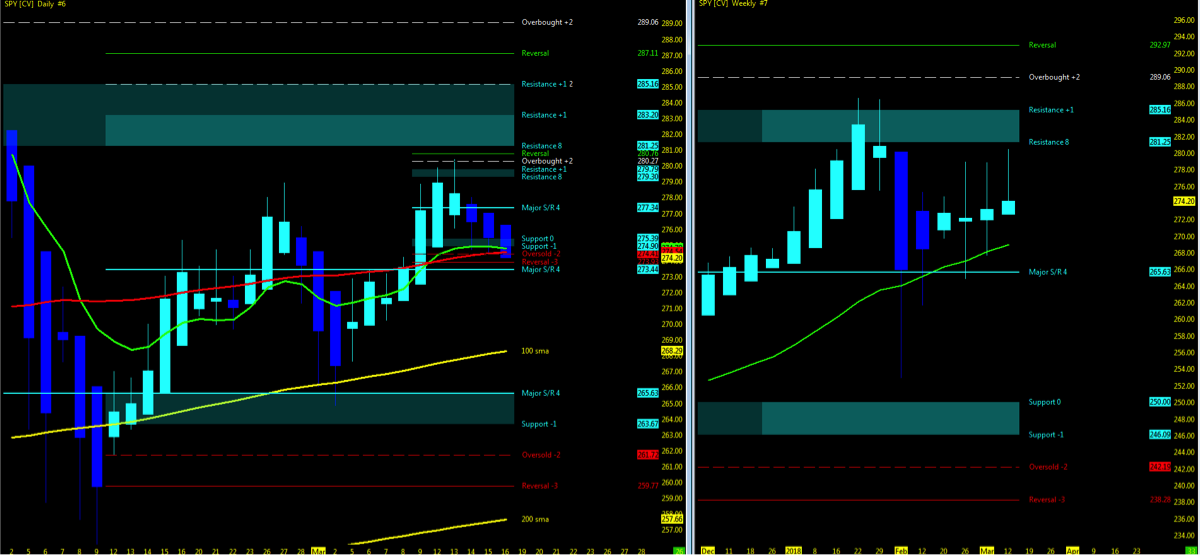
Attempting to determine which way a market will go on any given day is merely a guess in which some will get it right and some will get it wrong. Being prepared in either direction intraday for the strongest probable trend is by plotting your longer term charts and utilizing an indicator of choice on the lower time frame to identify the setup and remaining in the trade that much longer. Any chart posted here is merely a snapshot of current technical momentum and not indicative of where price may lead forward.
Current Technical Trend…
- VIX Volatility Index levels start the week in the high 15’s as momentum has consolidated.
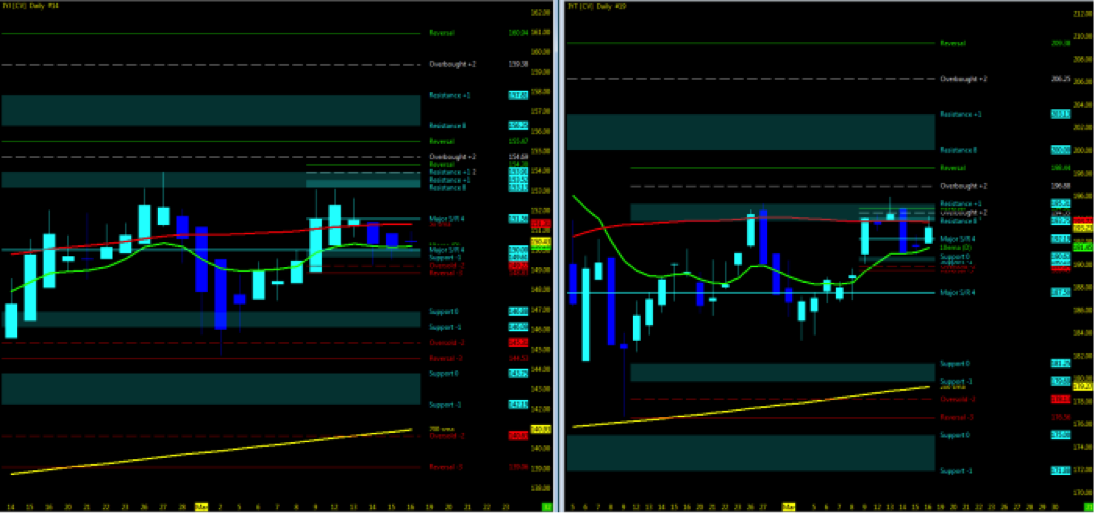
- Dow Industrials / Dow Transports
-
- Monitor these two indices. When they are in sync, it’s a supporting indicator of momentum (Up or Down). When they are out of sync, it’s a divergence.
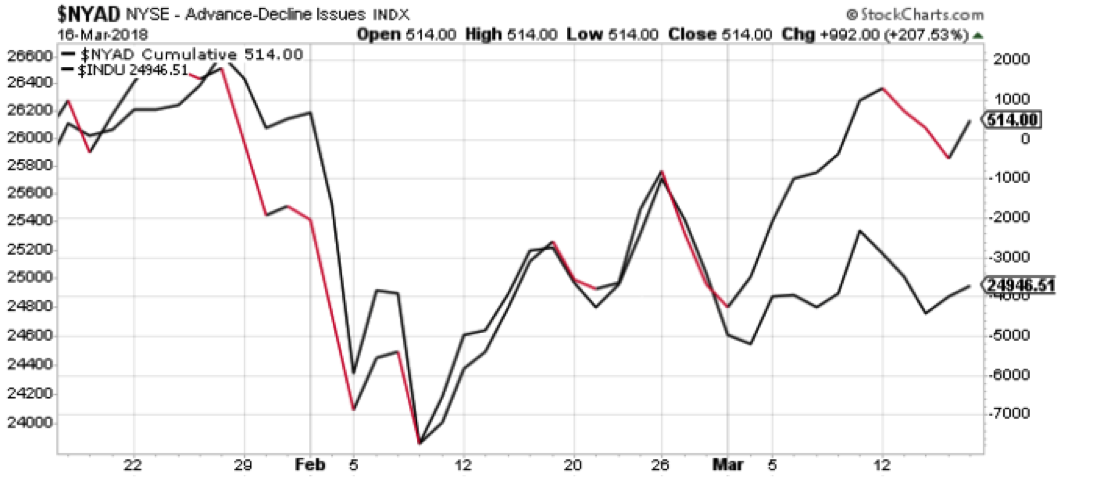
- Advances-Decliners/INDU in sync (uptrend)… but watch the Dow Industrials.
The Bottom Line
Short and simple because truth be told, sideways price action just doesn’t give me much to think about.
Contract rollover, CPI data out and FOMC ahead in week 12 was enough for the market indices to pull back to their perspective 10ema’s. CONSOLIDATION is the key word here as the key technical charts that I follow each week as posted above to paint a picture of momentum or pullback remain in an UPTREND. As we all may know, consolidation is an opportunity that will breakout in either direction.
Q2 will soon close and a fresh new season of earnings to roll in and either support this momentum or give the market reason to pullback further is yet to be seen. The waiting game may be just what the market will play out here and could last for the remainder of 2018 if need be. I implore you to use the easiest and simplest of technical indicators and monitor the moving averages and look for crossovers and where price is in relation to. While the NQ has made new all time highs and RTY has bounced back, it is the ES/YM that remain to hover and cling to their perspective 10/50 period ma’s.
Big Picture: Keep your eyes on the Q2 re-balancing of your long term portfolios, swing positions watch for the breakout of the 10ma and intraday, always be ready in both directions for setups that are all in sync and with the highest probability of trend momentum as seen below.
Thanks for reading and remember to always use a stop at/around key technical trend levels.
Twitter: @TradingFibz
The author trades futures intraday and may have a position in the mentioned securities at the time of publication. Any opinions expressed herein are solely those of the author, and do not in any way represent the views or opinions of any other person or entity.


