THE BIG PICTURE
Investors are operating in a volatile stock market climate so it pays to be disciplined while remaining in trend within your given timeframe.
Stocks are trying to bounce here after last week’s beat down. There is plenty of “noise” due to market crosscurrents and bulls vs bears chatter. Traders need to follow the price action (and trend indicators) and steer clear of noise and opinions. If the market correction continues, your process (and stops and limits) should offer you new looks on both the long & short side of trades.
Below is my weekly stock market futures trading update and trend outlook. Let’s start by looking at a chart of the S&P 500 ETF (SPY).
S&P 500 Chart – Week 10 (week of March 5)
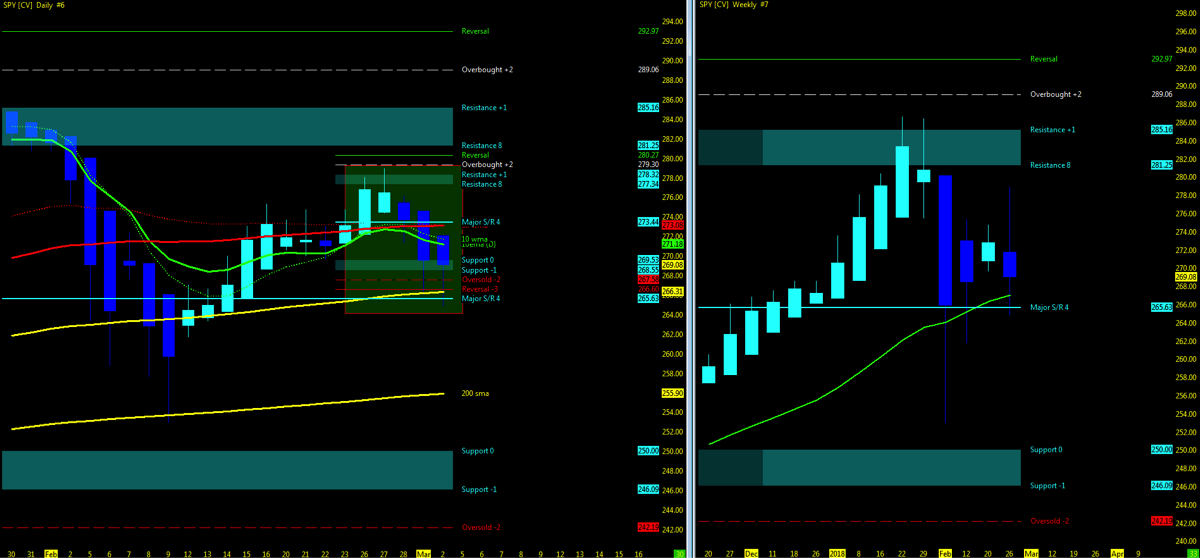
Using the Murray Math Level (MML) charts on higher time frames can be a useful market internal tool as price action moves among fractal levels from hourly to weekly charts. Confluence of levels may be levels of support/resistance or opportunities for a breakout move. Optimal setups will pass through Resistance or Support prior to moving in the opposite trend.
Technical Trends
- Week 09 recap and trend charts
- Indices pullback under 50ma/ 10ma remains under 50.
- Open Gaps above/below; none formed in week 08
- VIX levels at mid 19’s after peaking to 25 midweek
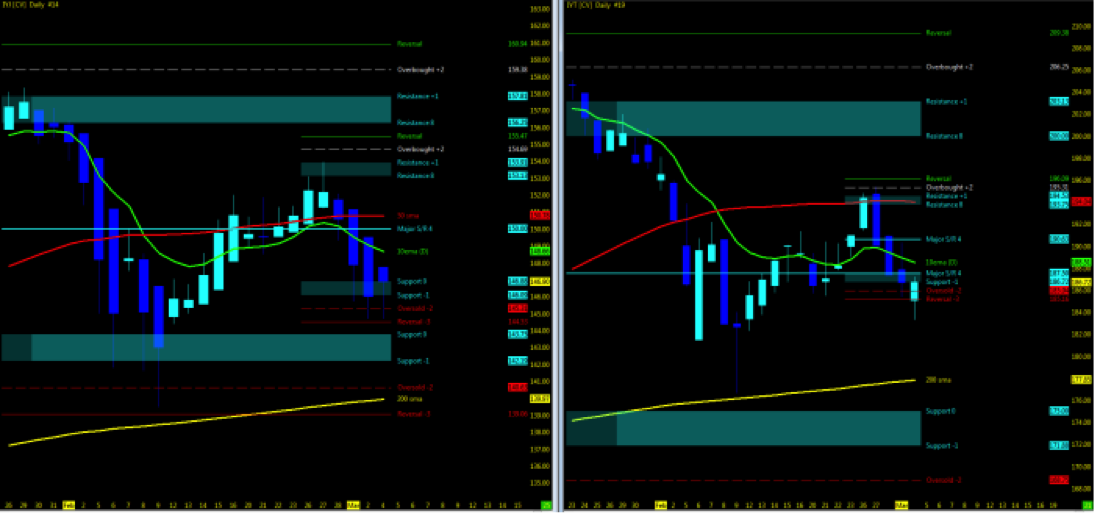
- Industrial/Transports
- Industrials: UPTREND under pressure; Transports: UPTREND under Pressure
- Monitor for the two ETF indices to remain in sync as supporting indicator of momentum (Up or Down)
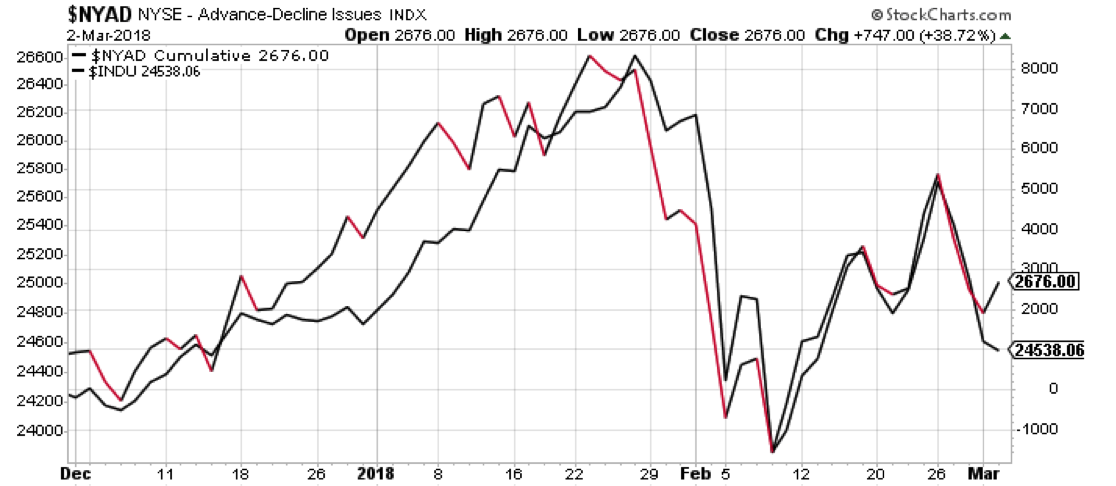
- NYAD (NYSE Advance – Decliners)/INDU
- A/D Up/Index down: Out of sync: market indecision
Check out this week’s Stock Market Trading Outlook Video
Key Events in the Market This Week
- USA: Earnings, Fed Speakers, ADP, Beige Book, Non-Farm Payrolls, Contract rollover begins
- Q4 earnings:
- Target
- Discount Stores
- Top Chinese stocks
- Aerospace
The Bottom Line
- Indices pulling back under 10/50ma’s
- 10 period moving averages holding under 50 on ES/YM/RTY
- NQ/XLK/FDN (F.A.N.G. ETF) strong uptrend, Moving averages 10>50>200
- UUP – Dollar index momentum BIG PIC remains downside
- VTI/FFTY consolidation in uptrend
- VXX (VIX ETF) volatile, remain in partial uptrend
- NYAD/INDU momentum divergent: Indecision
- IYJ/IYT in sync in DOWNTREND
- Downside Open Gaps remain open to be closed
My 3 Cents
I’ll keep it simple.
Unless price action can hold above the 10ema, and the 10ema doesn’t close above the 50ma, downside open gaps, Long term MML levels and the 200ma seem more probable at this point.
With contract rollover looming, economic data coming out and non-farm payroll as the we await the next FOMC meeting, with VIX levels above 15 and peaking around 25, higher time frames and patience for your technical setups is the most prudent position you could be in.
Pay heed to each side of the aisle as there are just as many calling for the upside as to the downside. Tech still remains strong and if able will pull the remainder of the market with. For now, consolidation at the tops seems to be the call as we may just waffle in between the highs and 200ma before we either make new highs or project for lower lows. Truth is, no one knows and only those in the end that make the call and who get it right will wave their flag, the rest will hide under a rock.
So do yourself a favor. If your an intraday player, always be ready in both directions as overall trend doesn’t watch the big pic. Swing positions you had an opportunity to the short and for now hold on downside until price action breaks back above the 10ma. Long term, watch for lower prices at the end of Q2.
Technically there is no question that the lean of probability is in consolidation in the uptrend with tech leading the march up. Signs of more of a pullback are positive and can easily play out as the contract expires. Otherwise, watch for the momentum off the lows of the daily session and monitor the strength back upside. Watch the opening for the week and see if price is able to close above day one and back above the 10ma. Use the daily Heiken Ashi bars to signal trend strength. It’s weekly DOJI time which means, flip a coin, it can go either way.
Until that happens, leave your bias at the door, and watch the charts in front of you.
Attempting to determine which way a market will go on any given day is merely a guess in which some will get it right and some will get it wrong. Being prepared in either direction intraday for the strongest probable trend is by plotting your longer term charts and utilizing an indicator of choice on the lower time frame to identify the setup and remaining in the trade that much longer. Any chart posted here is merely a snapshot of current technical momentum and not indicative of where price may lead forward.
Thanks for reading and remember to always use a stop at/around key technical trend levels.
Twitter: @TradingFibz
The author trades futures intraday and may have a position in the mentioned securities at the time of publication. Any opinions expressed herein are solely those of the author, and do not in any way represent the views or opinions of any other person or entity.


: Showing Some Signs of Emerging Strength")
