THE BIG PICTURE
The major stock market indexes continue to rally higher and remain in strong up-trends. Market strength is persisting for much longer than most traders have anticipated. It is for this reason that traders need to follow the price action (and indicators) and steer clear of the noise. When the market begins a pullback, your process should stop you out of the trade… and/or offer new looks on both the long & short side of trades.
Here’s my weekly stock market futures trading update and trend outlook. We’ll start by taking a look at the S&P 500 ETF (SPY).
S&P 500 Chart – Week 51 (week of December 18)
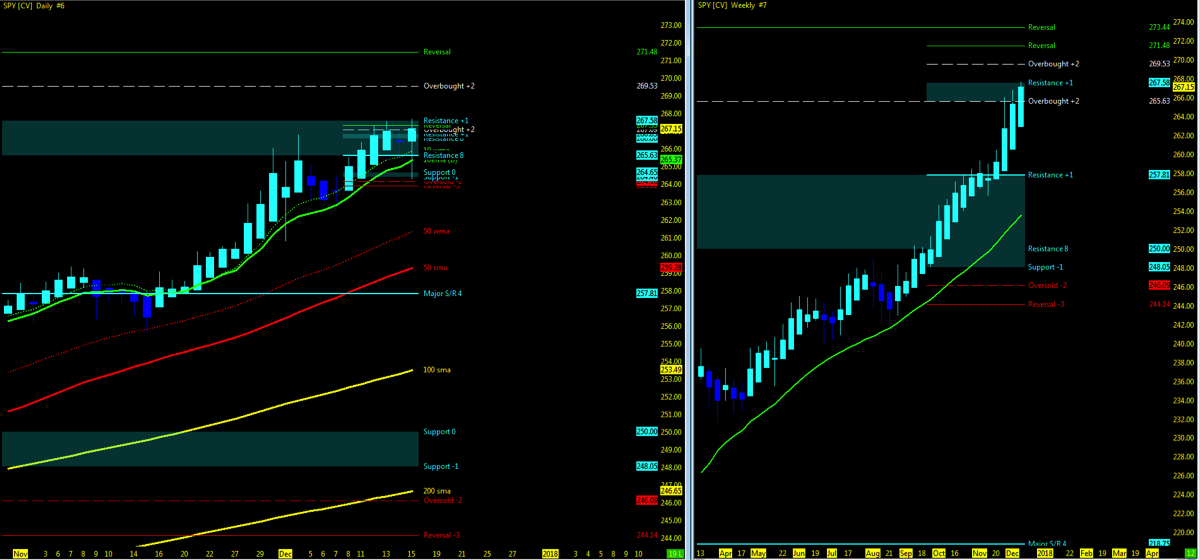
Using the Murray Math Level (MML) charts on higher time frames can be a useful market internal tool as price action moves among fractal levels from hourly to weekly charts. Confluence of levels may be levels of support/resistance or opportunities for a breakout move. Optimal setups will pass through Resistance or Support prior to moving in the opposite trend.
Technical Trends
- Check out my full week 50 recap and trend charts
- The major stock market indices are back at NEW all time highs.
- The Russell 2000 remains 25 points off downside.
- Open gaps remain downside on all 4 stock market indices.
- The VIX Volatility Index is holding in the mid 9’s,
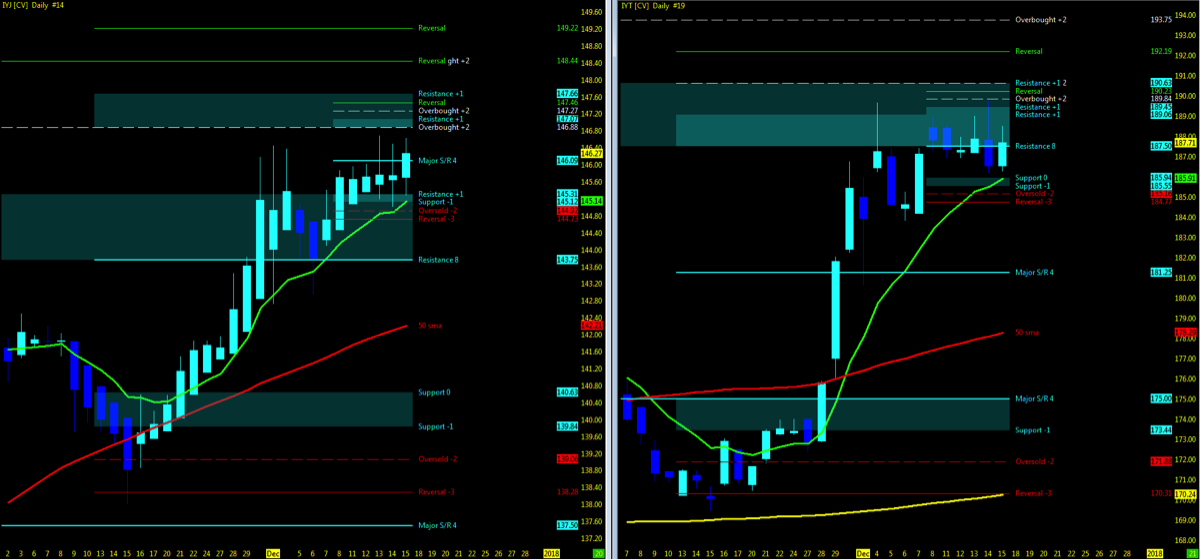
- Dow Industrial and Transports
- Transports pullback off MML resistance with Industrials marching to next MML level upside
- Monitor for the two ETF indices to remain in sync upside as supporting indicator of uptrend momentum
- FANG/FAAMG represented by the FDN (ETF) in UPTREND on both Weekly/Daily
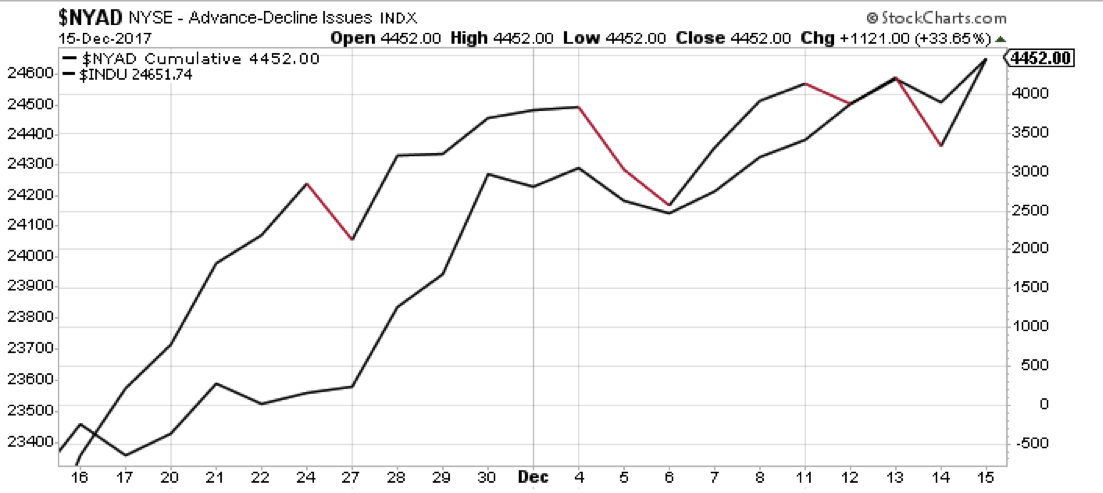
- NYAD (NYSE Advance – Decliners) and Dow Industrials in sync trending to the upside.
You can also view my Market Outlook Video.
Key Events in the Market This Week
- USA: Housing, GDP, Personal Income, Consumer Sentiment
- GLOBAL: FR – CPI, GB – BOE Announcement
- Q3 Earnings Season
- Nike Fiscal Q2, Micron Fiscal Q1, Fedex
- Indices futures – All volume in new contract
- CME launches bitcoin futures (CBOE last week)
THE BOTTOM LINE
Uptrend Technical Probability
- Key moving averages in sync on indices with no crossovers
- The stock market indices remain at all time highs – go higher (IBD motto)
- VIX Volatility Index holding under 10
- IYJ/IYT in sync upside above 10ema
- NYAD/INDU momentum upside
- VTI momentum upside
- UUP – Dollar index momentum BIG PIC downside
- FDN/TECH uptrend
Downtrend Technical Probability
- Downside Open Gaps
- Price action pushing at MML high resistance on both long and short term levels
- FFTY Consolidation
- McClennan Adv/Dec indicator struggling to maintain uptrend (@KennyPolcari)
- Bloomberg Commodity Index (BCOM): is not pretty….it is now down 5% since early November and the longer term trendline is downward…… The index has now broken all supports and is struggling to hang on, but with no near-term support in sight. (@KennyPolcari)
- Most equity/index charts show weakness (haDelta) in weekly and monthly time frames (@EDUCOFIN)
Isn’t it tiring to keep reading all the Posts/Tweets and articles all claiming the tops? Look, I’m like you. I would welcome the pullback to close out downside gaps. Healthy markets do exactly that and when the momentum starts to shift, it will be clear and evident. The term “bubble” continues to be thrown around and 2018 is the year we pullback and so on. Roll back to 2007 when the term bubble was consistently being thrown around in the housing industry, and many were not interested in subscribing to that frame of mind. Likewise today, I remain outside this community and stick to the technical’s. I may not be able to call the tops or wish to but there are those that would love to hang their shield of honor to claim they told you so.
Look at your charts, watch the momentum and manage from the bottom up for this train has not run out of steam yet. Don’t worry yourself about adding to a position short that you can’t keep adding to because your pockets are simply not that deep. The bottom line for me remains the data remains positive. Tax reform for what it may be worth at this point will keep the market up. Retail sales are doing well. Of course at any point, geo-political landscape can change that in a heartbeat. Watch for the Q4 data to set off the the tone for 2018. For now, I view the probability on both sides and as it
Watch for MML setups on price action break above resistance high and back under resistance low for first signs of a pullback. Downside, watch for open gaps to be closed and 50% pullback as 1st level of support.
Attempting to determine which way a market will go on any given day is merely a guess in which some will get it right and some will get it wrong. Being prepared in either direction intraday for the strongest probable trend is by plotting your longer term charts and utilizing an indicator of choice on the lower time frame to identify the setup and remaining in the trade that much longer. Any chart posted here is merely a snapshot of current technical momentum and not indicative of where price may lead forward.
Thanks for reading and remember to always use a stop at/around key technical trend levels.
Twitter: @TradingFibz
The author trades futures intraday and may have a position in the mentioned securities at the time of publication. Any opinions expressed herein are solely those of the author, and do not in any way represent the views or opinions of any other person or entity.
: Creating Bullish Divergence?")


: Creating Bullish Divergence?")