I am back from 2 weeks of whirlwind travel and presenting at both the Money Show in Las Vegas and Charting Forward at Stockcharts.com
I thank Geoff Bysshe, the President of MarketGauge.com for filling in for me.
After the market has absorbed bank crises, debt ceiling talk, the Fed Funds rate at 5.25%, earnings misses and beats, calls for recession and hopes for lower inflation, we have plenty more to say.
Since I will be joining Maggie Lake and the folks at Real Vision at 4 PM ET (you can find it on their channel on YouTube), I thought sharing my notes in preparation for that would be a good comeback for my Daily writing.
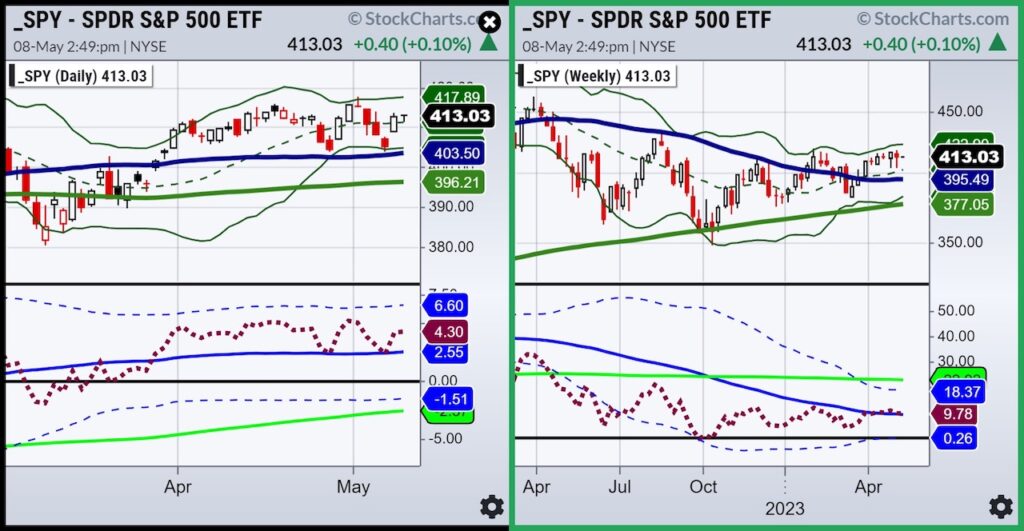
The S&P 500 charts show 2 different timeframes.
The first is the daily chart.
SPY is in a daily bullish phase. The price is not too far from the early May peak, which sits just under the 23-month moving average or 2-year business cycle.
The Real Motion indicator illustrates no real divergence3e as that too is in a bullish phase.
On the weekly charts, SPY is also in a bullish phase above both the 50 and 200-WMAs. Momentum here, has a divergence.
SPY momentum sits on the 50-WMA which sits beneath the 200-WMA or in a recuperation phase.
What do these charts suggest?
Based on this “Would you sell in May, and go away?”
Market resiliency with just a touch of pessimism.
Some areas to watch:
KRE or Regional Banks-if the price holds 37.05 then it is possible the worst is over. If that level fails, expect more bad news.
The Economic Modern Family-regardless of what SPY is doing, the Russell 2000 (IWM) needs to hang in there and clear 180. Granny Retail XRT, must hold 60.
Transportation IYT is a bright spot and if clears 230-the case for more upside is clearer.
Inflation-basic materials lag, but industrial metals particularly copper ($3.93), played catch up.
Precious metals (gold $2028 Silver $25.70) continue to outperform. With CPI PPI this week, we will know a bit more although CORE PCE is still high.
Oil-China consumption rose. Brent Crude Oil rallied to $77.00 per barrel. Above $80 shorts will cover and energy will rebound higher.
102 stocks made new 52-week highs today. Shopify, O’Reilly, Shake Shack, Builders FirstSource are a few.
111 stocks made a new 52-week low. Match.com and Tyson Foods stood out.
Tech stocks-Apple looks amazing as does Microsoft, Nvidia. SMH the ETF is over a key monthly MA and could expand.
Dollar-as long as it holds 100.70 neutral.
Some picks:
Live Streaming Sports and Music
Country ETF Vietnam
Biotech stocks
Copper
Our discretionary trading strategy is now based on finding instruments using our Complete Trader Scans that fits one of these setups:
My prediction-SPY QQQs DIA continue to rally-until IWM cannot clear $200-then everything sells off again.
Stock Market ETFs Trading Analysis & Summary:
S&P 500 (SPY) 23-month MA 420
Russell 2000 (IWM) 170 support – 180 resistance
Dow (DIA) Over the 23-month MA-only index
Nasdaq (QQQ) 329 the 23-month MA
Regional banks (KRE) 42 now pivotal resistance
Semiconductors (SMH) Split 2:1 now above 23-month MA at 124
Transportation (IYT) 202-240 biggest range to watch
Biotechnology (IBB) 121-135 range to watch from monthly charts
Retail (XRT) 56-75 trading range to break one way or another
Twitter: @marketminute
The author may have a position in mentioned securities at the time of publication. Any opinions expressed herein are solely those of the author and do not represent the views or opinions of any other person or entity.


