Last year’s coronavirus stock market crash turned into a BIG opportunity for active investors to buy stocks at deep discounts… especially COVID-friendly stocks.
Since the March 2020 crash low, stocks have rallied sharply for 11 months… and this rally has a couple of important stock market indices testing important resistance levels.
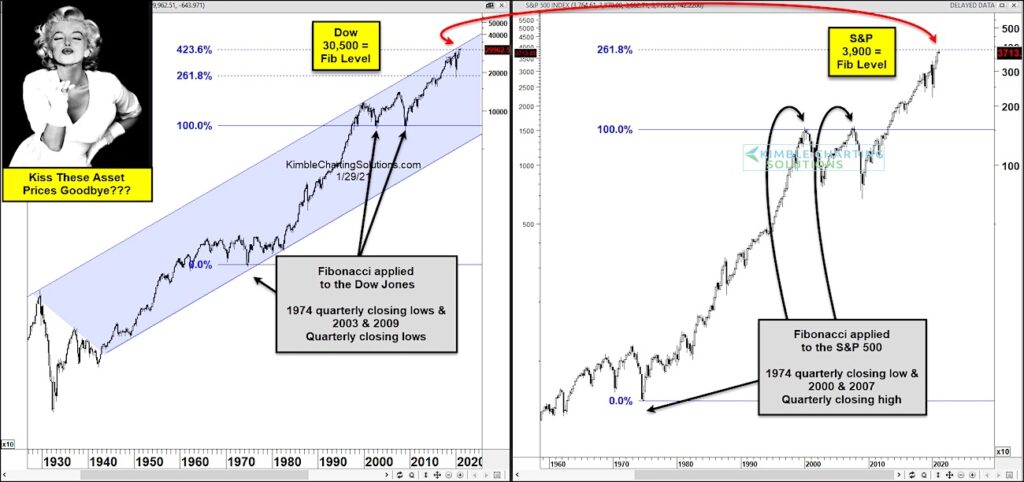
In today’s chart 2-pack, we examine these stock indices: the Dow Jones Industrial Average and S&P 500 Index. And we apply Fibonacci principles to long-term historical charts.
As you can see, when we use Fibonacci analysis on the 1974 and 2003/2009 lows, we get a 423.6% Fibonacci extension level at 30,500. This is a huge stretch resistance level… and it’s being tested right now!
At the same time, the S&P 500 is testing is testing a key Fibonacci level. When using the 1974 low and 2000/2007 closing high, you get a 261.8 Fibonacci extension level at 3900. And, yep, it’s being tested right now!
I’ve never seen fib levels from such key long-term highs and lows potentially come together like this! Stay tuned!
Dow Jones Industrial Average and S&P 500 Index Chart
Note that KimbleCharting is offering a 2 week Free trial to See It Market readers. Just send me an email to services@kimblechartingsolutions.com for details to get set up.
Twitter: @KimbleCharting
Any opinions expressed herein are solely those of the author, and do not in any way represent the views or opinions of any other person or entity.


