I have discussed the remarkably broad strength being seen in the stock market recently and that has continued this week.
In fact, on Monday over 70 percent of the stocks in the S&P 500 Index traded at new 20-day highs (signaling another market breadth thrust). As well, more than 50 percent closed at new 20-day highs. The number of stocks in the S&P 500 making new 6-month highs spiked to its highest level in over a decade (h/t @sstrazza).
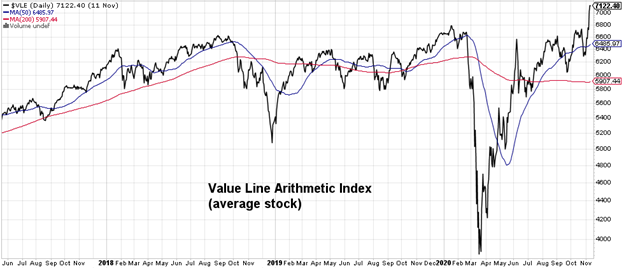
The Value Line Geometric Index (which represents the median stock) has broken above well-tested resistance (and could soon challenge the multi-year pattern of lower highs). Its Arithmetic cousin (which is a proxy for the average stock) has already broken out to a new all-time high. New highs reflect strength and history shows that this type of strength tends to persist.
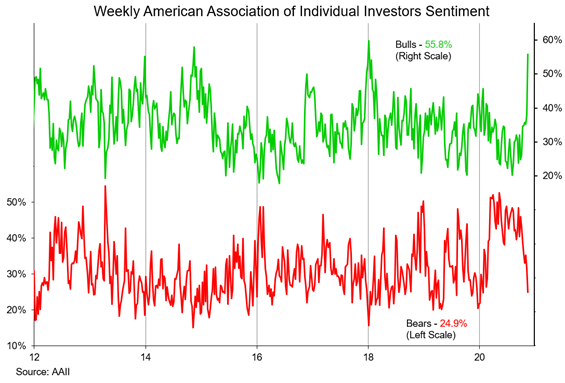
This strength is not happening in a vacuum and has not been un-noticed. Individual investors have taken a decidedly more optimistic view on stocks. They appear to be pushing all their chips to the center of the table, with AAII bears (24.9) dropping to their lowest level since Jan 2020 and bulls (55.8) soaring to their highest level since Jan 2018. This brings individual investors more in line with the views expressed in the Investors Intelligence survey of advisory services and the NAAIM survey of active investment managers.
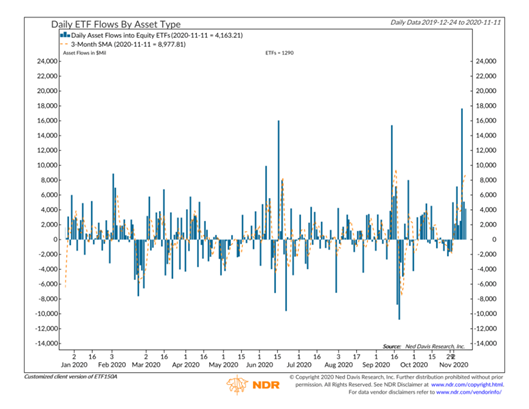
This shift in views has been accompanied by actions. Over the first three days of this week, equity ETF’s have seen $26 billion in inflows. The 20-day total soared above $40 billion. Despite the remarkable strength on stocks overall over the past decade-plus, they have tended to stumble when the 4-week total of equity ETF inflows has topped $23 billion. This week’s update could send the 4-week total to its highest level since January and into a bearish zone for stocks.
Bottom line: The weight of the evidence is bullish. Post-election seasonal patterns and remarkably strong rally participation are historically reliable tailwinds for stocks. The sentiment situation, however, suggests the seas could get choppy and sailing may not be so smooth.
Twitter: @WillieDelwiche
Any opinions expressed herein are solely those of the author, and do not in any way represent the views or opinions of any other person or entity.
: Cup (and Maybe Handle) Watch")
 Trading Near Top Of Price Range")
 Reaches Important Price Support")