Key Stock Market Takeaways:
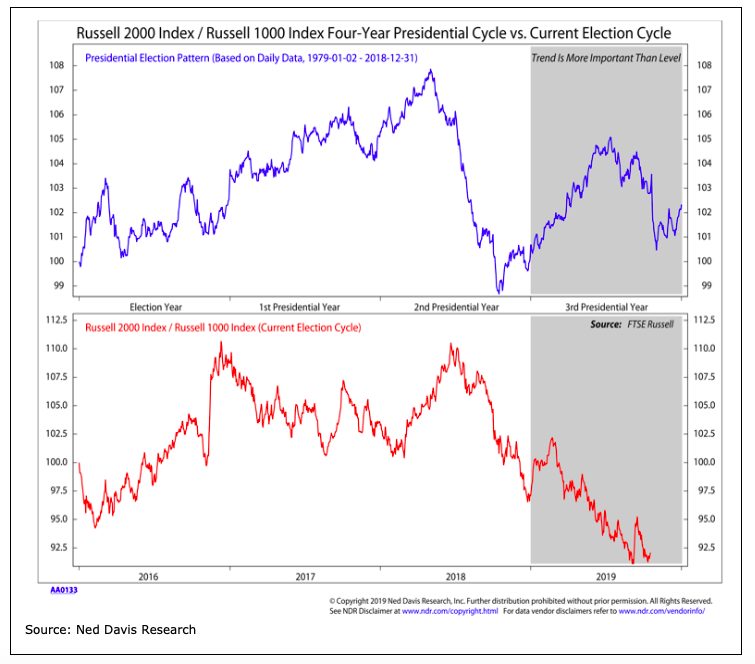
– Small-cap stocks and cyclical leadership on the Russell 2000 Index INDEXRUSSELL: RUT would lower risk that Q4 2018 gets repeated.
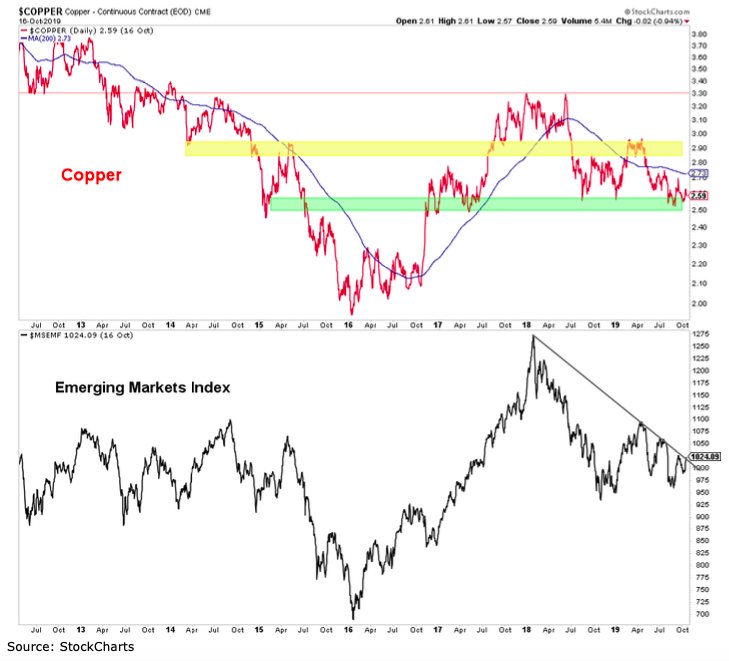
– Seasonal strength in Copper would be a tailwind for Emerging Markets.
– New highs for European stock indices suggest shift in longer-term leadership.
That stocks tend to make an interim bottom sometime in October is a widely reported historical fact. Since 1950, the S&P 500 Index INDEXSP: .INX has experienced an annualized return of 12.8% from 9/30 to 4/30, with an annualized return of just 1.0% from 4/30 to 9/30.
Small-cap stocks have experienced an even greater disparity of returns between those two periods. This tendency has helped popularize the “sell in May” mantra. Investors being conditioned to look for late-year seasonal strength, however may be covered by the idea that “what everyone knows isn’t worth knowing” (variations of this saying have been attributed to journalist Walter Lippmann and/or financier Bernard Baruch).
Q4 seasonal stock market strength was also expected to emerge in 2018, but quite the opposite happened. We do not expect 2019 to follow the pattern of 2018, but we want to look beyond the seasonal strength headlines for evidence that historical trends are holding true to form.
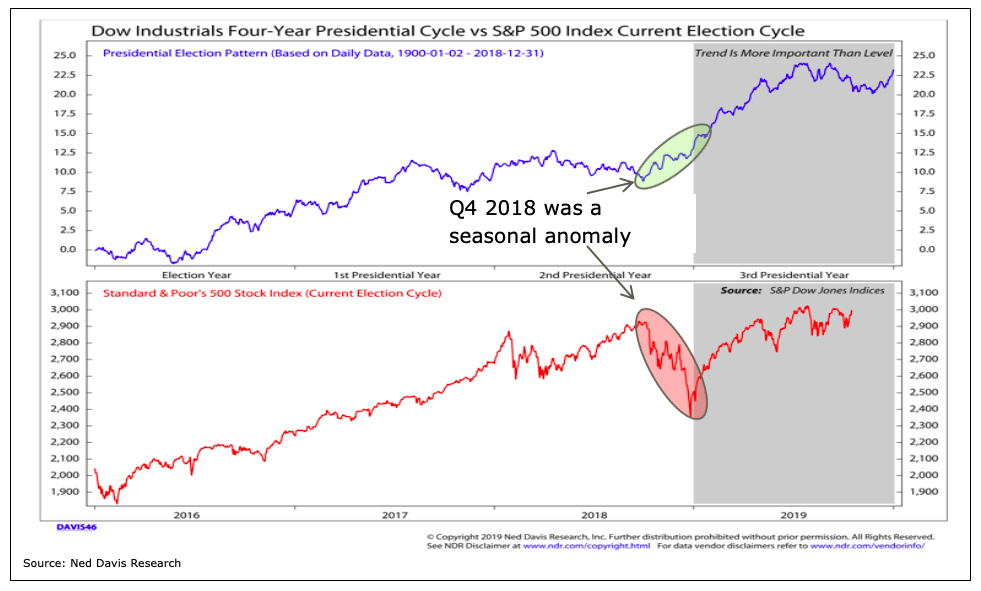
In looking for confirmation of seasonal strength, we can begin by finding evidence within the U.S. stock market. This includes improving breadth and momentum for the S&P 500. Given the experience of 2018, we are keenly interested in the relative performance of small-caps versus large-caps. Small-caps failed to take the expected lead in Q4 of 2018 and have thus far not demonstrated much leadership in 2019. Our industry group studies, however, show small-cap groups with improving relative strength trends and a modestly improved tone from the breadth data could help fuel small-cap strength.
Sector-level leadership trends can also provide evidence that seasonal patterns are holding true to form. Over the past 20-years the strongest two sectors of the S&P 500 over the last two months of the year have been Industrials and Materials. Industrials have outperformed the S&P 500 by an average of nearly 2 percentage points over the final two months of the year and the Materials sector has outpeformed the S&P 500 by an average of nearly 3 percentage points.
If seasonal patterns are holding, these two recent relative strength laggards could gain ground on Utilities, Real Estate and Technology (leaders in 2019, but also sectors that tend to lag the S&P 500 over the final two months of the year). Keep an eye on our weekly relative strength rankings to see if this is happening.
When we last wrote about seasonal patterns (Stocks and Copper Facing Seasonal Challenges, September 5) we noted that copper seasonal patterns shift from headwind to tailwind in the fourth quarter. If this is manifesting itself in 2019, copper could build on its recent resiliency and move toward resistance. Emerging market stocks could be a primary beneficiary of such a move and they appear poised to break through a downtrend off of their early 2018 peak. From a seasonal pattern perpsective, December and January have tended to offer the best opportunity for Emerging Market leadership. Relative strength ahead of that would be encouraging.
Late-year stock market strength really is a global phenomenon. The recent new highs in Europe provide some confirmation of this and may also be signalling a longer-term shift in leadership away from the US and toward other equity markets.
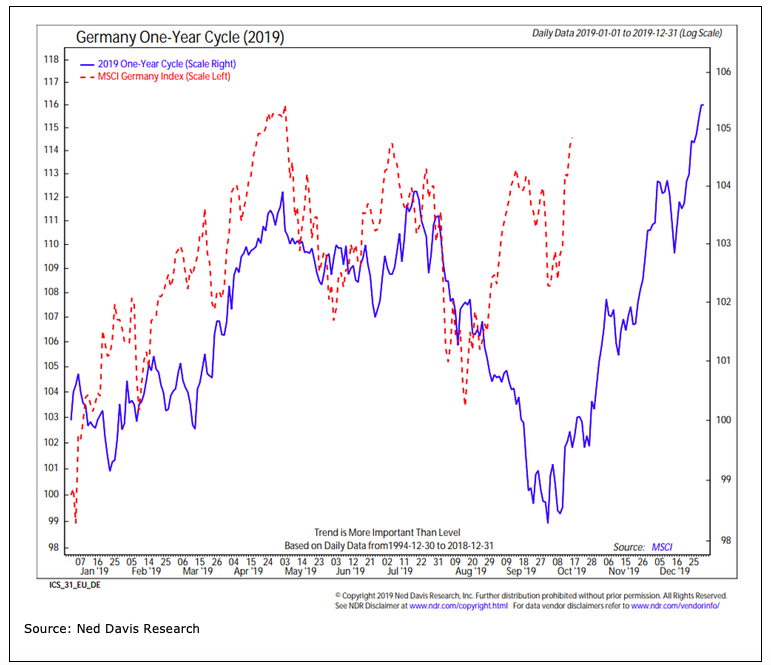
Germany has held true to its seasonal tendencies in 2019, with early-year and late-year strength providing bookends for mid-year consolidation. While the chart shows that the MSCI Germany index has not (yet) moved to a new high, the DAX did make a new 52-week highs this week. In fact, more than a handful of European and global indexes have made new 52-week highs more recently than have the U.S. equity market indexes.
Twitter: @WillieDelwiche
Any opinions expressed herein are solely those of the author, and do not in any way represent the views or opinions of any other person or entity.


: All Energy Hands on Deck!")

: All Energy Hands on Deck!")

