S&P 500 Index Trading Outlook (3-5 Days)- No conviction
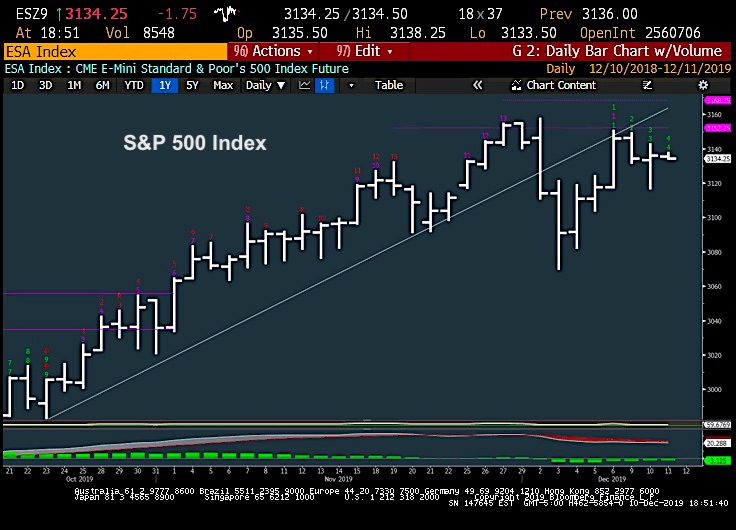
The rally stalled out near former highs but with no real technical damage (as of yet). See S&P 500 Index chart below. INDEXSP: .INX
Many cycles still point lower into mid-December before a year-end rally.
That said, here’s the bottom line: Our trading line in the sand is 3116 (on S&P 500 futures).
BULLISH over 3116, and BEARISH under 3116
Note as well that climbing above 3151 would be very constructive.
The S&P 500 trend remains inconclusive near-term.
That said, the weekly charts holding up in a very bullish manner for now. After the two-month trend was broken, the S&P 500 saw little follow-through to the downside before rallying back.
Now we’ve seen some stalling out ahead of the all-important 12/15 date for a potential US/China breakthrough and/or rollbacks of Tariffs. Also of note, short-term cycles typically can show weakness into mid-December before bottoming.
Overall, late December is due to be positive seasonally and it’s not thought that major weakness is in store over these next 1-2 weeks. For now, prices lie in No-man’s land and tough to have much conviction here.
If you have an interest in seeing timely intra-day market updates on my private twitter feed, please follow @NewtonAdvisors. Also, feel free to send me an email at info@newtonadvisor.com regarding how my Technical work can add alpha to your portfolio management process.
Twitter: @MarkNewtonCMT
Author has positions in mentioned securities at the time of publication. Any opinions expressed herein are solely those of the author, and do not in any way represent the views or opinions of any other person or entity.


