This past Saturday, we waited on a long line of planes readying for takeoff.
The busy spring break travel time has begun.
When we left for the conference in Florida on March 11th, the Russell 2000 (IWM), closed at 154.29.
Today, IWM closed at 155.75, higher in price, but without any notable technical barriers pierced on the up or downside.
Furthermore, unlike the heavy traffic that the happy spring breakers are bringing to airlines and hotels, the volume in IWM has been unremarkable.
That of course makes sense, given the Russell 2000’s relatively narrow trading range.
If the Russell 2000 ETF (IWM) ready for takeoff?
And if so, what does that mean for the rest of the Modern Family?
There are 5 planes in the photo, but there are 6 economic Modern Family members.
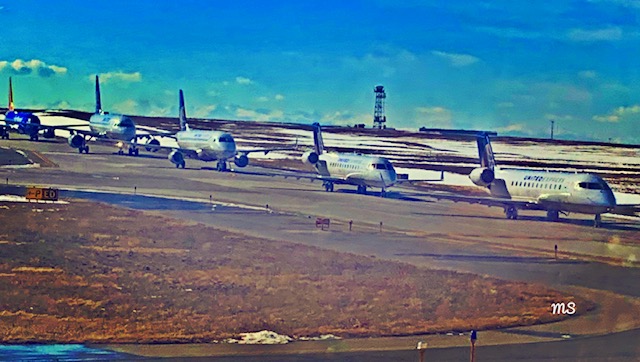
One sector, we will see in a moment, is on the line, but having some issues communicating with control tower.
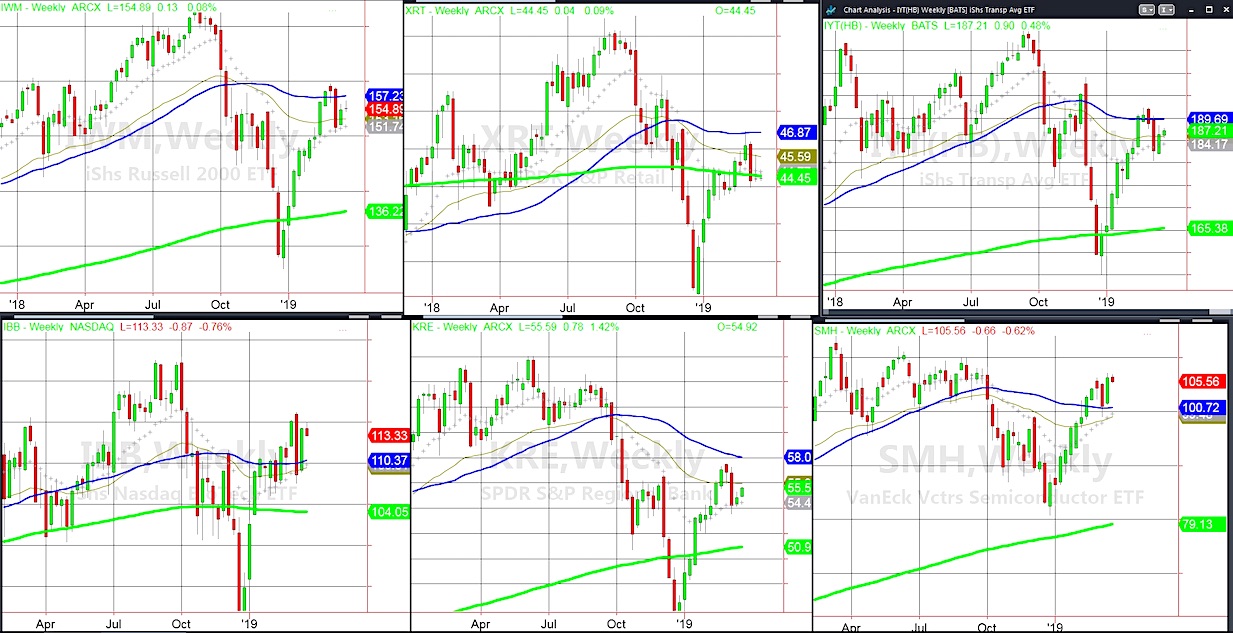
The charts are weekly with the blue line the 50-WMA and the green line the 200-WMA.
When we left, all but that one sector were trading above their 200-WMAs. Plus, only 2 sectors were above their 50-WMAs.
What if anything has changed?
Top left is the chart of IWM.
That it has held support lower or around 151.80 is a positive.
That it is still trading within the big ugly red bar from 2 weeks ago, is indecisive.
That it cleared then failed the 50-WMA is a negative.
Retail XRT, is the 6thmember that we cannot see on the runway. How it closes this week-above or below 44.64 or the 200-WMA will be telling.
Transportation IYT, is a mirror of IWM. Always a key to the market, it showed more weakness than IWM 2 weeks ago. To date though, the pattern is so much like IWM, you should watch both instruments.
Biotechnology IBB is stronger, above the 50-WMA. The price indicates more of a bullish bias, however, note that it too is still trading within the range of the big red bar.
Regional Banks KRE also mirrors the price action of IWM and IYT. That puts in on the runway, but without all engines revving.
Semiconductors SMH, is in the best shape, similar to IBB, only sitting at the top of last week’s trading range. Look here and one would think the air traffic controllers are assuming a smooth takeoff.
Basically, getting all the Family off the ground successfully or not, will very much depend on the Control Tower.
And who you might ask, sits in the control tower?
The Federal Reserve, or the ones who have taken the responsibility for ensuring a safe, orderly and expeditious flow of money into the market.
S&P 500 (SPY)– Made another new swing high today at 282.66. Today’s low 281.30 now must hold on a closing basis.
Russell 2000 (IWM)– 154 is the best nearby support level to hold. 157.45 is the 200 DMA resistance to clear as this is the only holdout of the 4 indices still below the 200-DMA.
Dow Jones Industrials (DIA)– 257 is the underlying support. 260 the pivotal resistance
Nasdaq (QQQ)– New swing high today at 178.99. Has to hold/close over 177.59
KRE (Regional Banks)– 55 is pivotal now with 56 a place of resistance to clear
SMH (Semiconductors)– Inside day. Watch 107.12-104.70 as the range to break one way or another
IYT (Transportation)– 185.65 important support now. 190 substantial resistance
IBB (Biotechnology)– 115 resistance and 110.40 the best underlying support
XRT (Retail)– It’s all about 44.64 the 200-WMA pivotal point
Twitter: @marketminute
The author may have a position in the mentioned securities at the time of publication. Any opinions expressed herein are solely those of the author, and do not in any way represent the views or opinions of any other person or entity.


 Sending a Warning to Tech Stocks?")


 Bounce a Sea Change or Just Noise?")