Key Stock Market Takeaways:
– Poor momentum, a more challenging seasonal backdrop and increasing investor optimism could weigh on stocks as summer winds down.
– Pullbacks that do emerge could provide an important test of the robustness of the broad market improvements seen recently.
– The NASDAQ Composite INDEXNASDAQ: .IXIC could be particularly vulnerable if stocks do move into consolidation mode.
The S&P 500 Index INDEXSP: .INX made new highs in July (as recently as last week) though the climb higher has been relatively quiet. Prior to the up-tick in market volatility in the wake of this week’s interest rate cut by the Fed, the S&P 500 had not had a 1% move (up or down) in 35 trading days.
While price moved higher over the course of June and July, momentum has rolled over and is moving lower.
The deterioration in momentum being seen in the S&P 500 is confirmed by weakening momentum trends seen at the sector level (see page 2 of Market & Sector Trend Summary publication for regular updates of sector-level trends). Breadth on the S&P 500 remains a mixed bag – the percentage of stocks trading above their 200-day average has followed the index higher and at 73% is fairly robust, but after a June pop higher, the number of stocks making new highs has waned.
In addition to poor momentum trends, poor seasonal tendencies in August/September and evidence of increased optimism among investors could make further near-term rally attempts more hard fought. If a pullback emerges, initial support could be found near 2930. The pattern of higher lows remains intact as long as the S&P 500 remains above 2750.
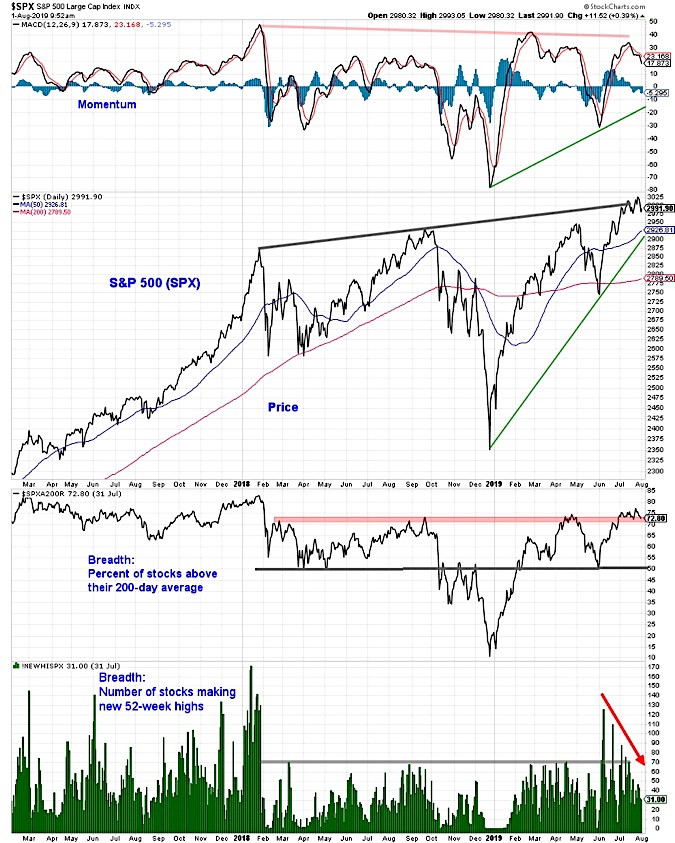
In addition to the potential benefits of relieving optimism and re-setting the price and momentum trend, a pullback would provide a test of the recent improvements seen in the various breadth indicators. Most of the broad market improvement in 2019 has come in reaction to price gains. More robust evidence of strength would be broad market resilience despite price weakness.
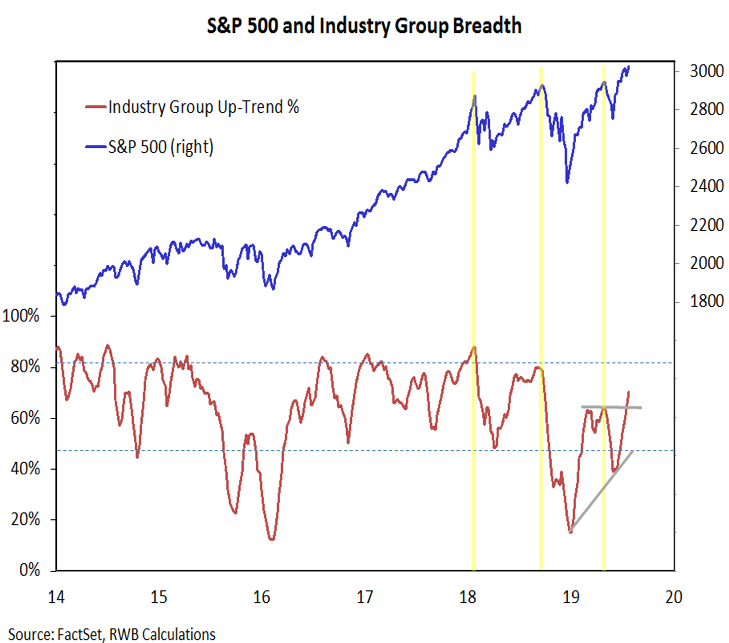
Regardless, recent breadth improvements have been encouraging. Our industry group trend indicator has made a higher high following a higher low, evidence that the gains in the U.S. are becoming more widely distributed.
Additional improvement can be seen in the international markets. Oversold bounces in the first half of the year are now transitioning into more widespread up-trends. The percentage of global markets in up-trends (defined by rising 200-day moving averages) has risen above the 50% threshold.
As can be seen, this has been associated with global stock market strength in the past. This could be seen as a step toward the leadership from international stocks that we have argued is overdue (see this week’s Portfolio Perspectives).
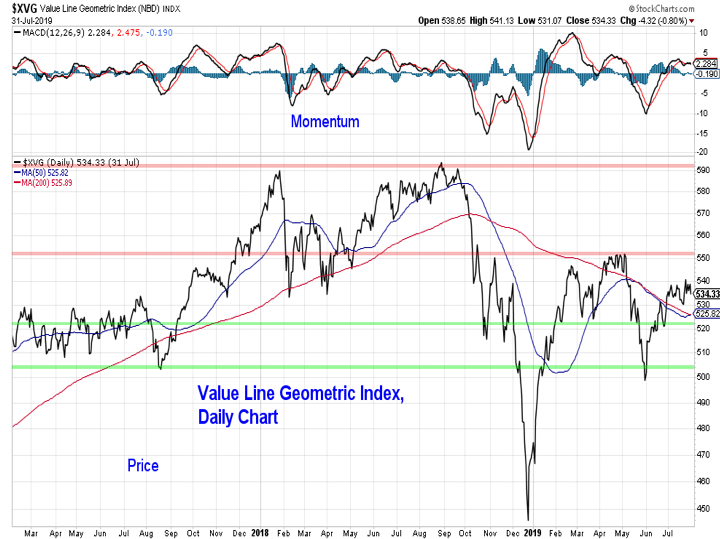
We will keep watching the Value Line Geometric Index for evidence of broad rally participation. Momentum here has been less robust than for the S&P 500, and the index itself remains below May peak, let alone the late-2018 highs.
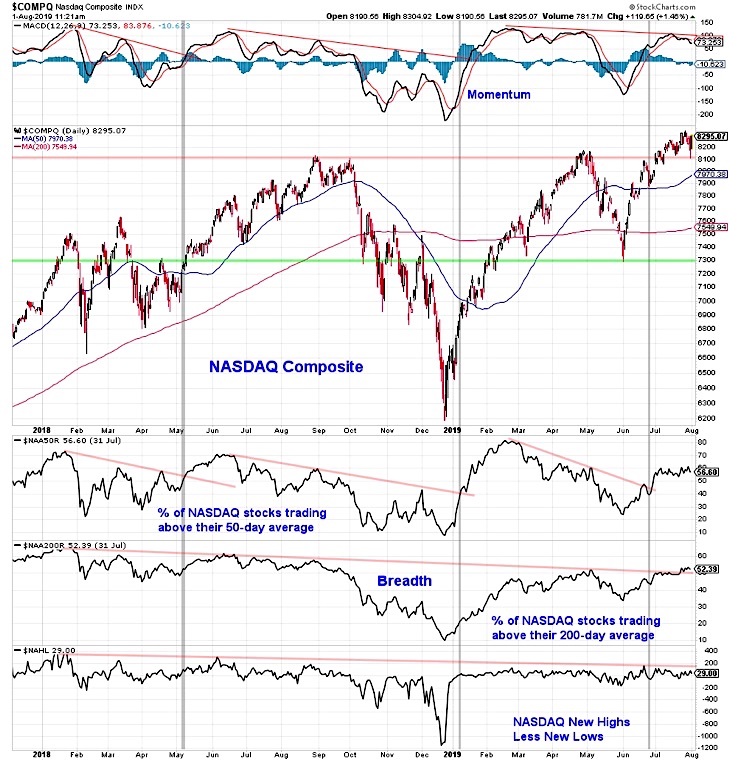
If a pullback does emerge, the NASDAQ composite could be particularly vulnerable to weakness. New price highs in July followed the expansion in the percentage of stocks trading above their 50-day averages but lacked confirmation from momentum (which has continued to wane).
Market breadth gains overall have been less robust on the NASDAQ than seen elsewhere (only slightly more than half of the stocks on the NASDAQ trade above their 200-day averages and even with the composite making new highs, the number of stocks making new highs has not consistently outpaced the number making new lows). Further, sentiment indicators specific to the NASDAQ have shown more excessive optimism than stock market sentiment in general.
Twitter: @WillieDelwiche
Any opinions expressed herein are solely those of the author, and do not in any way represent the views or opinions of any other person or entity.


