S&P 500 Index (INDEXSP: .INX) “weekly” Price Chart
The stock market has been resilient in 2019, grinding higher… and grinding bears out of the market.
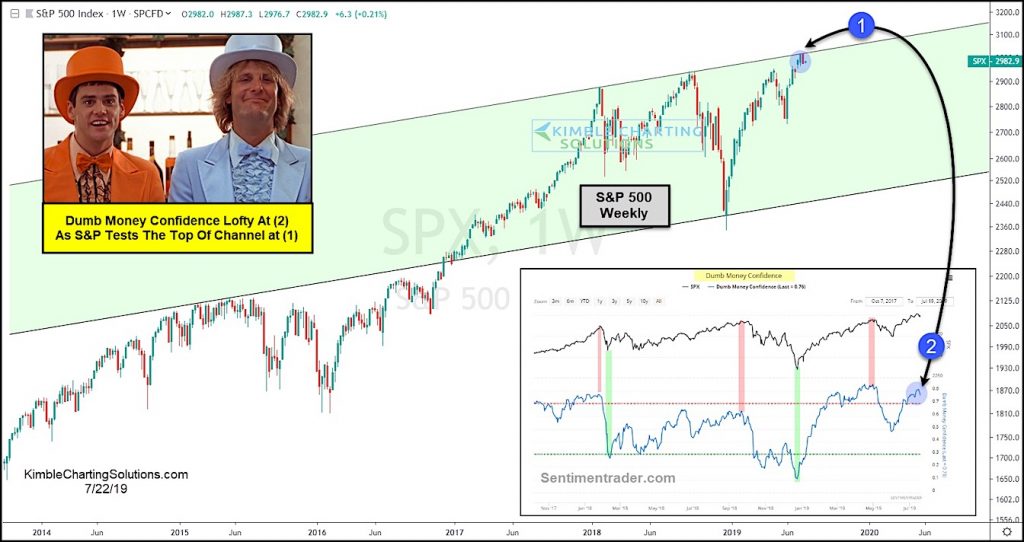
But at the same time, this persistence often catches the eyes of the “moms and pops” out there. This is often referred to as dumb money.
When non-professionals begin to buy stocks from the professionals, it’s often a sign of a top. And that may be occurring here… at the same time that the stock market is testing important resistance.
The S&P 500 Index is testing a key breakout level at (1), as Dumb money confidence (per Sentimentrader) is nearing the highs of the past 18-months at (2).
In theory, this should limit upside… and perhaps even indicate that the stock market is in the process of creating a near-term peak.
Note that KimbleCharting is offering a 2 week Free trial to See It Market readers. Just send me an email to services@kimblechartingsolutions.com for details to get set up.
Twitter: @KimbleCharting
Any opinions expressed herein are solely those of the author, and do not in any way represent the views or opinions of any other person or entity.

: Showing Some Signs of Emerging Strength")
