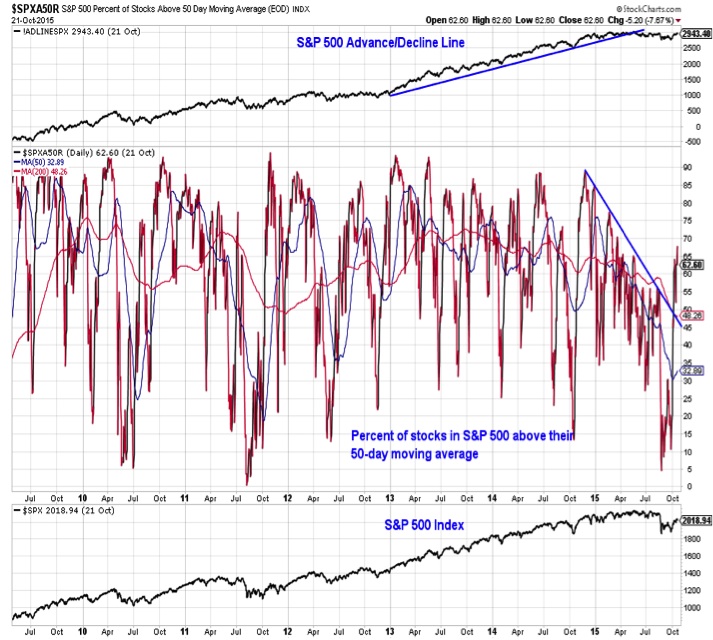
Market Breadth – Advance-Decline Line
Evidence of broad-market stability continues to emerge.
After bottoming at 5% in August and 10% in September, the percent of stocks in the S&P 500 trading above their 50-day averages has recently expanded to above 60%. This has broken a persistence downtrend that emerged over the previous year. Further evidence of broad market strength could come with a new high on the S&P 500 advance/decline line.
The September re-test of the August S&P 500 lows also featured a sharp reduction in the percentage of stocks making new lows. More recently, net new highs have expanding. This too reversed a year-long down-trend.
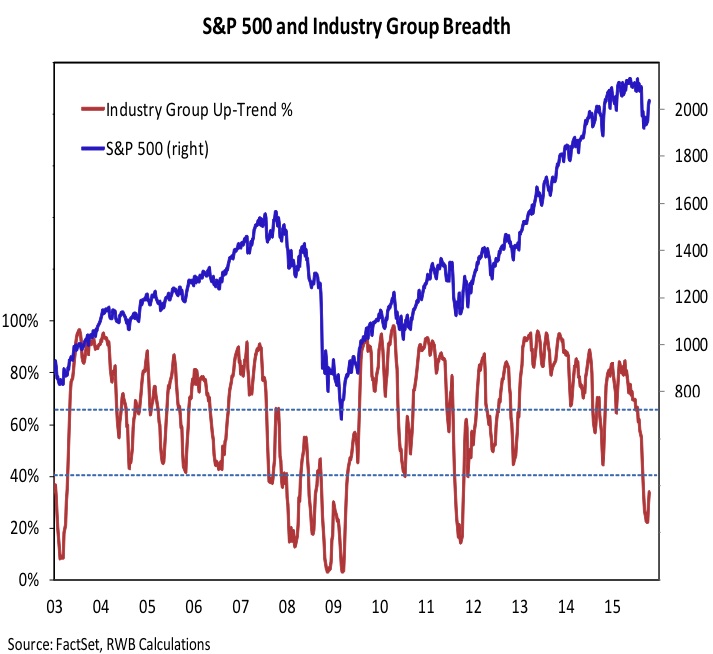
Market Breadth – % Industry Groups in Uptrends
The percentage of industry groups in uptrends was as high as 85% in mid-April. After falling in 19 of the ensuing 25 weeks, it bottomed at 22% in the first week of October. It has bounced back to 34% as the rally off of the index lows has attracted broad market support.
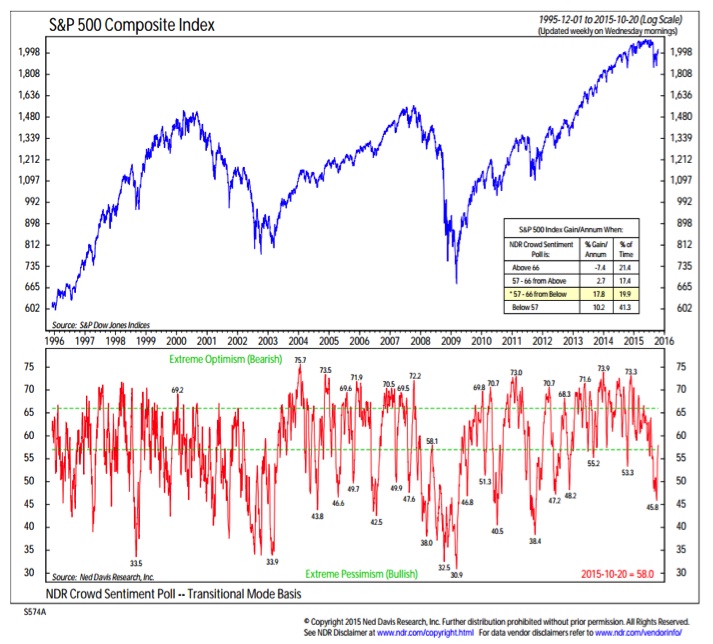
Market Sentiment
Identifying pessimism extremes in real-time can be tricky, but the most bullish market sentiment signals come after those extremes are obviously in place and optimism is beginning to return. Additionally, given the wide availability of market sentiment surveys (which can offer inconsistent messages), our preferred approach to using market sentiment is to rely on composite indicators (of which the NDR Crowd Sentiment Poll is an example). The current rise in optimism in the wake of excessive pessimism is bullish for stocks.
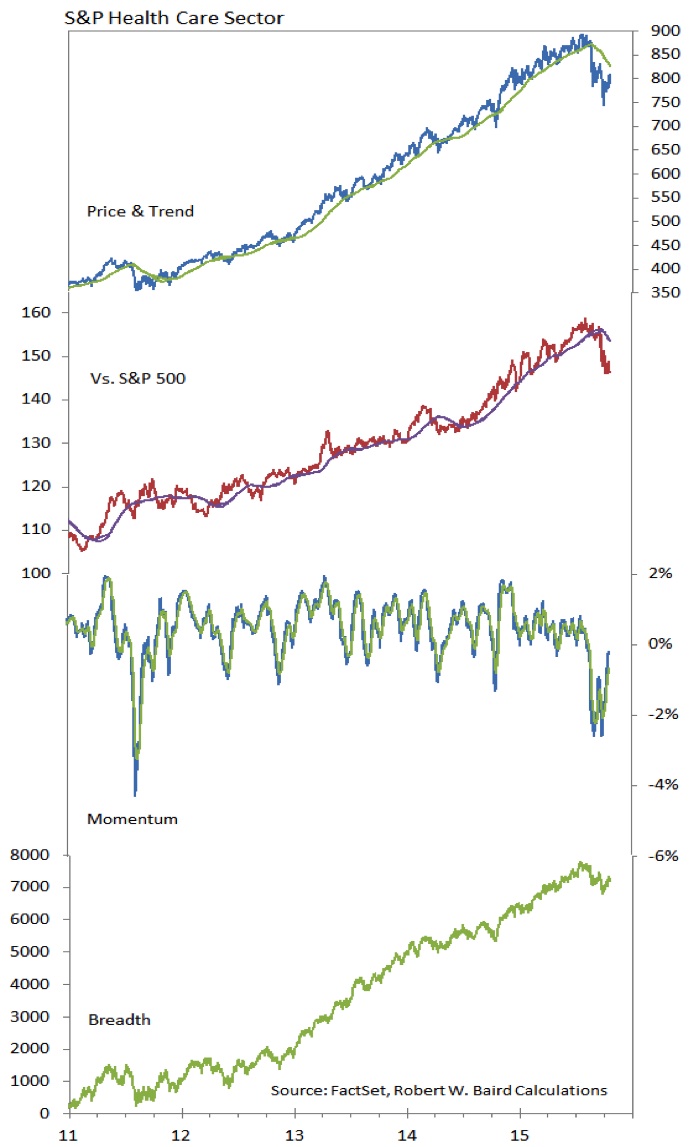
Health Care Sector
The Health Care sector continues to lose relative strength, slipping in our sector relative strength rankings to the eighth spot (out of 10). This is the lowest ranking for the sector since April 2014. Weakness in the sector has conitnued this week, with health care down another 3% as stocks overall have made modest gains on the week. Weakness in the sector is not limited to the Biotech group, but volatility there is weighing on the sector overall. The four-year streak of relative outperformance by the Health Care sector could come to an end in 2015.
Thanks for reading and have a great weekend.
Twitter: @WillieDelwiche
Any opinions expressed herein are solely those of the author, and do not in any way represent the views or opinions of any other person or entity.


