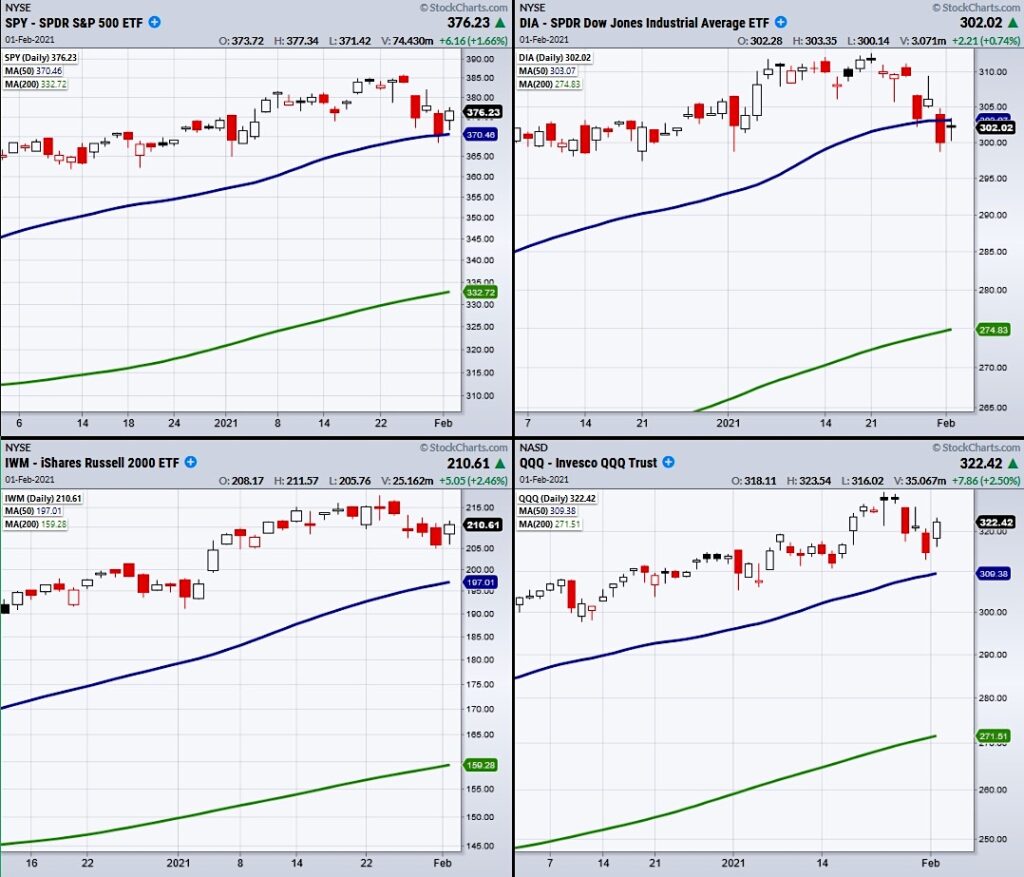
The Dow Jones Industrial Average (DIA) sits alone under the 50-day moving average, while his friends, Russell 2000 (IWM), Nasdaq 100 (QQQ) and S&P500 (SPY) cleared Fridays highs and remain above their 50-day moving averages.
Though only the DIA ended under the 50-day moving average, it still had an inside day which shows digestion of its current price area.
This is a hopeful sign for Tuesday compared to where the market left off on Friday of last week, as not only had the DIA broke its MA but the SPY had as well.
If both had continued to head lower a small correction could easily escalate to a bigger correction.
This does not mean we should let our guard down, but this does show that the market is holding its bullish phase.
We define a bullish phase by the location of price compared to the major moving averages.
For instance, bullish phase criteria is created when the price of a security is over the 50-DMA and the 50-DMA is over the 200-DMA.
The next phase where the DIA currently sits is the caution phase.
This means the price is under the 50-DMA while the 50-DMA is over the 200-DMA.
Friday’s close had us concerned because of where the prices closed relative to the 50-DMAs.
If today had closed red, then that would have been a good sign to keep a close watch and take some risk off the table.
Furthermore, high yield corporate bonds (JNK) closed over its 50-DMA which indicates investors and the government are still supporting the risk on environment.
At least for now…stimulus is key.
Whenever you’re ready, here are 3 ways I can help you reach your trading goals…
S&P 500 (SPY) Holding over the 50-DMA at 371.11
Russell 2000 (IWM) Like to see 204 hold.
Dow (DIA) Inside day. With 50-DMA at 303.41
Nasdaq (QQQ) 309.62 main support.
KRE (Regional Banks) Support 52.91
SMH (Semiconductors) 220-221 support area.
IYT (Transportation) Watching to hold 214.50 area.
IBB (Biotechnology) Support 158.
XRT (Retail) Hard to predict right now with so much volatility. Holding the 10-DMA at 79.57
Twitter: @marketminute
The author may have a position in the mentioned securities at the time of publication. Any opinions expressed herein are solely those of the author, and do not in any way represent the views or opinions of any other person or entity.


