The major stock indices retreated last week with the Dow Jones Industrials (INDEXDJX:.DJI), S&P 500 Index (INDEXSP:.INX) and NASDAQ (INDEXNASDAQ:.IXIC) losing less than 50 basis points.
The decline in small- and mid-cap stocks was more severe with the Russell 2000 Index (INDEXRUSSELL:RUT) down 2.00% for the period. Selling pressure in commodities along with rising interest rates accounted for the reduction in the demand for stocks in the final month of the first quarter.
Although most of the economic data has surprised on the upside, the 9% drop in oil prices last week and the 6% plunge in copper prices from the 2017 high are sending mixed signals as to the health of the U.S. economy.
Additionally, a record trade deficit last month and wholesale inventory accumulation have triggered reductions in first-quarter GDP growth estimates to just 1.5%. Against this backdrop, the Federal Reserve is widely anticipated to raise interest rates 25 basis points on Wednesday with a 50%+ probability that Fed Chief Janet Yellen will push rates higher again in June. Friday’s stronger-than-anticipated jobs report included evidence that wage growth remains soft, which should help keep inflation from encouraging a more aggressive Fed and something other than a modest pullback in stock prices. Given the rise in stock prices in the fourth quarter and first quarter of 2017, it would not be surprising that stocks consolidate/correct in the second quarter.
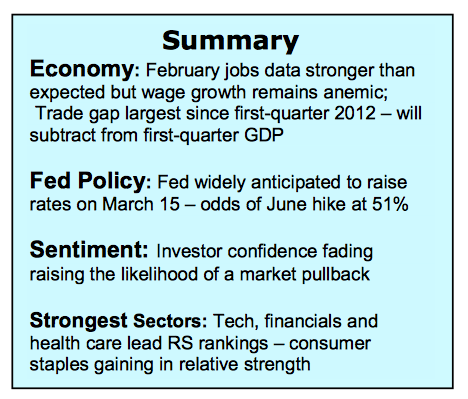
Stock market technicals have deteriorated with the loss of upside momentum in recent weeks. Short- and intermediate-term trends remain bullish but divergences have begun to surface. Small-cap stocks, which make up the Russell 2000 Index, have weakened considerably versus large-caps in March. The NYSE advance\decline line continues to make new highs, but the number of issues hitting new 52-week highs fell last week while the number of issues hitting new lows moved sharply higher. The combination of a loss in upside momentum and weakening market breadth could be signaling the demand side of the equation is tiring.
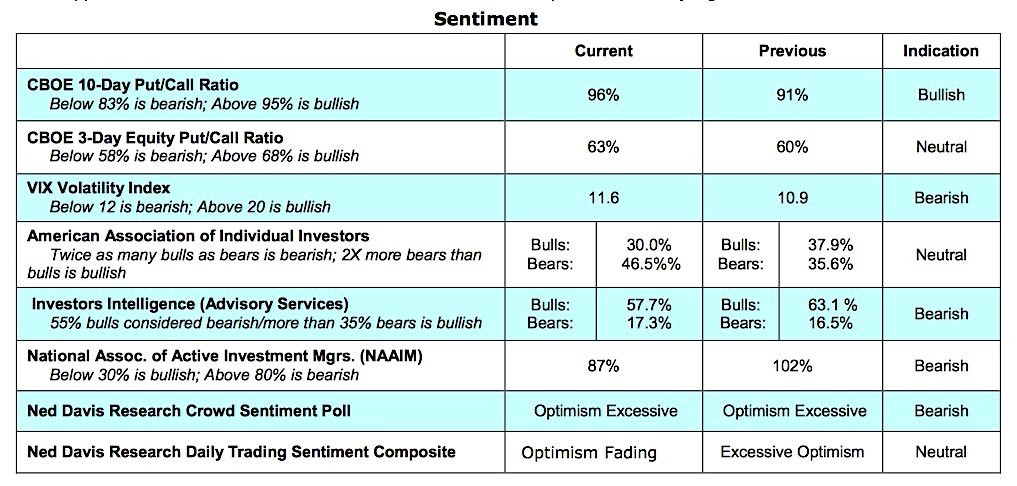
Measures of investor psychology show that bullish sentiment may have peaked. The most recent reports from Investors Intelligence (II) and the National Association of Active Investment Mangers (NAAIM) show a deterioration in investor confidence. The percentage of bulls in the II data dropped to 58% last week, ending seven consecutive weeks above 60%. Historically, a reading above 55% in the II statistics has signaled stocks were vulnerable to a pullback. Margin debt, which can be applied as a measure of investor sentiment, remains at a record high. Margin debt is considered bullish if it continues to rise but is a headwind for stocks when it is falling. Should margin debt turn down, it would support the thesis that demand for stocks had temporarily peaked. Support for the S&P 500 is near 2300 with resistance near the previous intraday high at 2400.
Thanks for reading.
Twitter: @WillieDelwiche
Any opinions expressed herein are solely those of the author, and do not in any way represent the views or opinions of any other person or entity.


