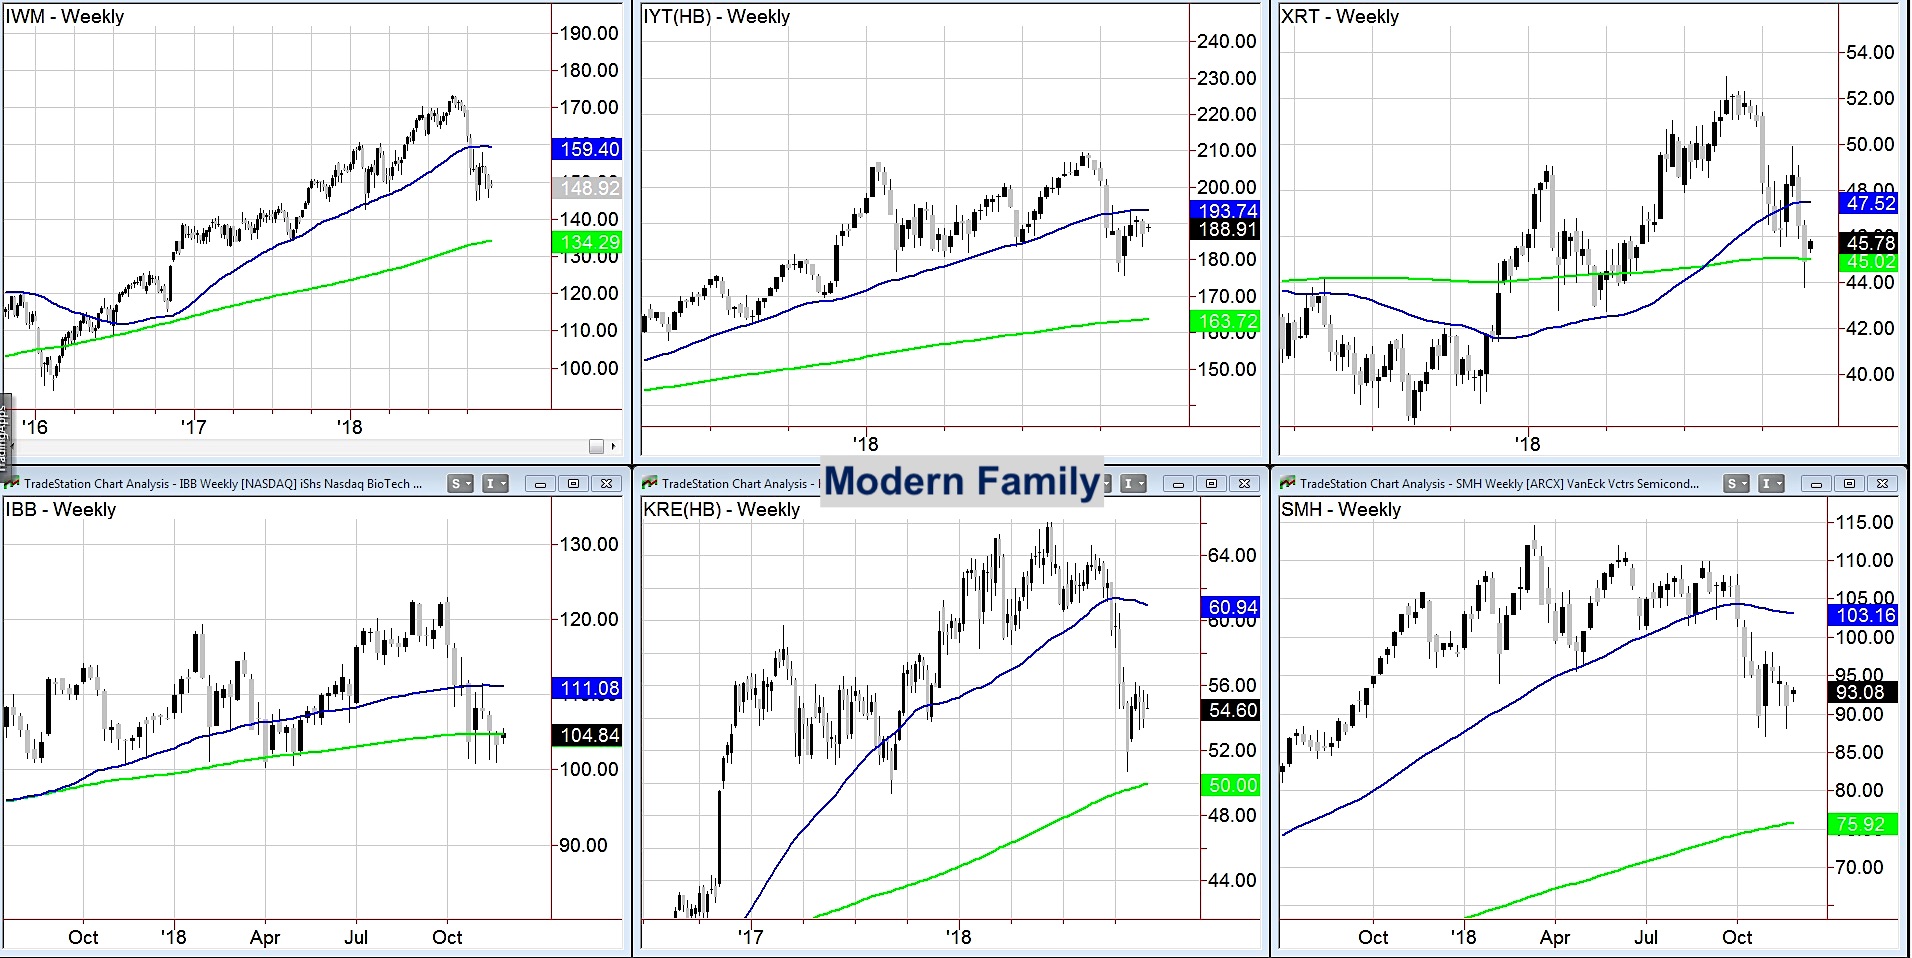
What I love about the “Modern Family” of ETFs, besides that they keep us on the right side of the market, is that it’s clear to see where money rotates in and out of.
The chart is a weekly timeframe of (top left to right) the Russell 2000 (IWM), Transportation Sector (IYT), and Retail Sector (XRT).
The bottom left to right charts are of Biotechnology Sector (IBB), Regional Banks (KRE), and Semiconductors (SMH).
With the price of the entire family under their negatively sloped 50 week moving averages, the market remains under pressure.
However, as a rally in negative markets can yield some good short-term profits, where would be the best place to invest some?
Criteria is important.
I suggest we use relative strength, if looking for a rally play.
Please take a moment to check out my upcoming book, Plant Your Money Tree: A Guide to Growing Your Wealth.
The member closest to the 50 WMA with the most neutral slope is Transportation.
And why am I not surprised?
Those of you who are long time readers of the Daily know that I hold a lot of credence in IYT as the best market predictor.
Hence, should IYT clear 190 and hold 185-186, then it has the closest trip to its 50-WMA or 193.75.
The rally can extend above that level. It would put IYT back in a bullish phase on the weekly, even though it is in a bearish phase on the Daily.
Should IYT get going, the next one closest to the 50-WMA is Retail.
I like this as a signal for two reasons.
First, seasonally, Retail, if the market holds, should rally in December.
Secondly, as XRT has tested the 200-WMA and held, a move over 46 can take it to 47.53, its overhead, neutrally sloped 50-WMA.
Therefore, watch IYT first and foremost-if folks are buying goods, we need Tran to distribute them.
If that runs, check out Retail next.
Then, if both of those kick into gear, you know you are in the best two Relative Strength sectors.
If neither can clear the aforementioned areas, go with the trend.
Weakest sectors if looking to short are Biotechnology, Regional Banks and Semiconductors.
The trend can be your friend in both up and down markets.
You just have to know where to look.
Trading levels for stock market ETFs:
S&P 500 (SPY) – 267 is the immediate pivotal support. 270 next resistance. 265 support.
Russell 2000 (IWM) – 150 pivotal. 148 support and 152 resistance
Dow Jones Industrials (DIA) – 248.50 resistance. Then 250 with support at 242
Nasdaq (QQQ) – After a new multi-month low at 157.13, it cleared 160-now pivotal with resistance at 164.50
KRE (Regional Banks) – 55.00 pivotal
SMH (Semiconductors) – 90.00 pivotal support. Resistance 93.50. Only a monthly close over 94.60 can turn this around.
IYT (Transportation) – Pivotal support at 188.75 then major at 193.75
IBB (Biotechnology) – The 200 WMA at 104.75-pivotal
XRT (Retail) – 45.00 pivotal support with 47.50 resistance
Twitter: @marketminute
The authors may have a position in the mentioned securities at the time of publication. Any opinions expressed herein are solely those of the author, and do not in any way represent the views or opinions of any other person or entity.


