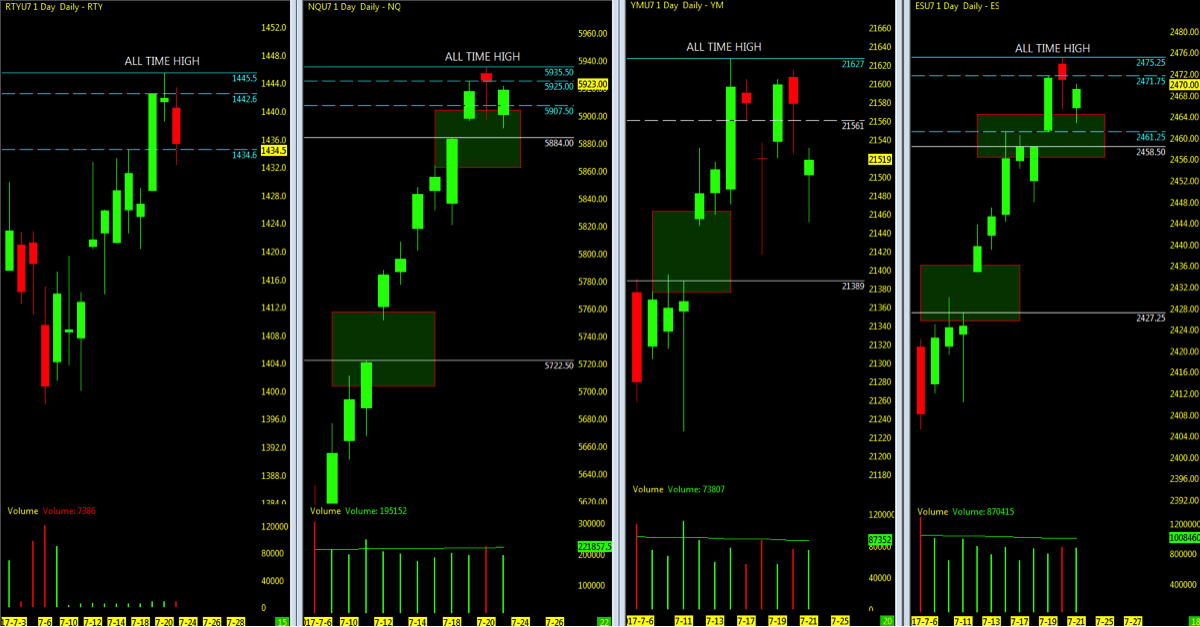
THE BIG PICTURE
The major stock market futures indices made new highs in week 29. And all except Dow Jones Futures (YM) closed above the weekly open. And the S&P 500 (INDEXSP:.INX) highlighted the broad market strength by pushing higher. An uber-calm VIX, though, should keep traders on their toes.
The major stock indices maintain momentum above the key moving averages and volume has been as expected for summertime. The key for day traders is being able to find those early AM trading setups. And for trend traders to follow key moving averages and trend indicators.
The Volatility Index (VIX) dipped even lower in week 29 and is currently holding under 10. The Russell 2000 (INDEXRUSSELL:RUT) continues to pick up volume and shows on intraday trend just how well price momentum can move. Earnings season is under way and with NFLX/MSFT data being positive, seemed to be enough to lift the other FANG/FAAMG stocks. Don’t forget about those permabears…they are licking their chops.
Technically by the charts, the indices open gaps from week 28/29 are the first targets downside on any pullback. Watch for any pullback to also test support off the nearby 10 and trailing 50 period moving averages. With momentum holding above the 10ema and sitting at all time highs, monitoring the daily Murray Math levels upside may be used as an additional tool on forward projection. Many US sessions have opened with the globex trend already played out making the regular trading hours that more difficult. Watch for the chop if price action opens near the globex high and lows and gauge the momentum when the setup looks like a high probability trend.
As always be ready for both directions in the unpredictable market.
Key events in the market this week are earnings, FOMC and GDP.
Technical momentum probability REMAINS in a UPTREND on the bigger pic as we hold above the key moving averages. As always, BEWARE of the catalyst wrench (Washington Politics) that looms overhead of if and when the market may sell off in reaction to unsettling news.
THE BOTTOM LINE
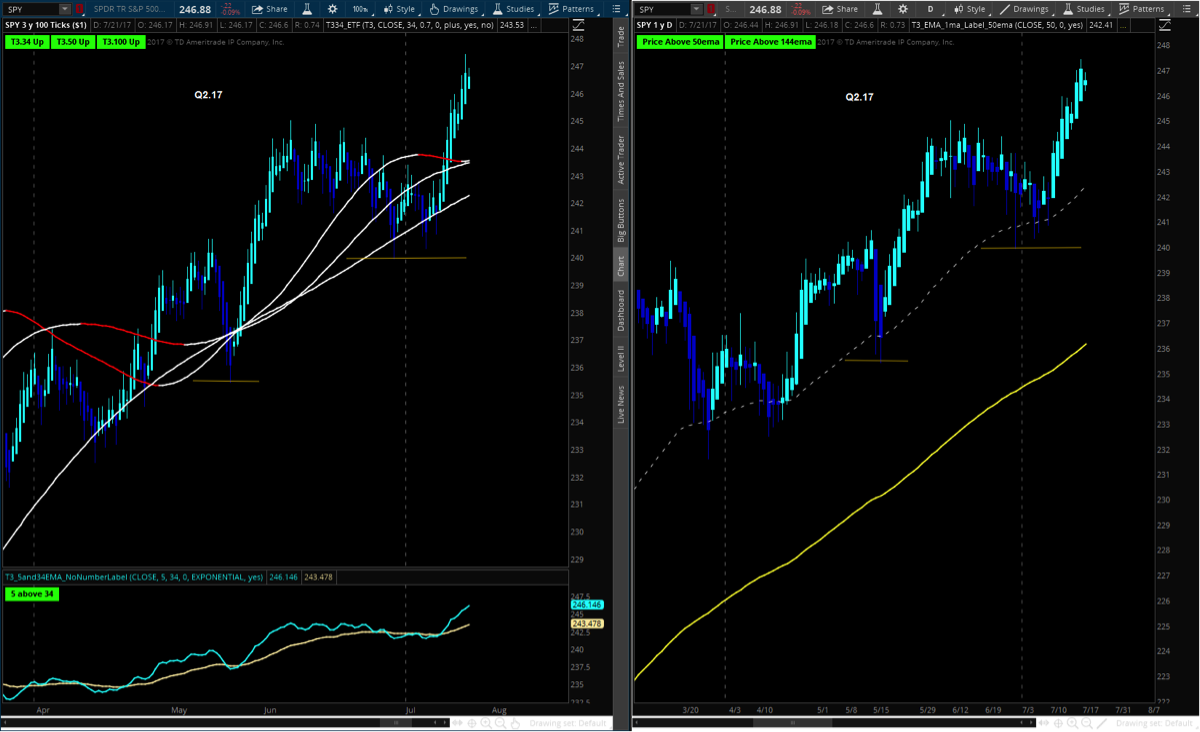
Rinse and Repeat….with all indices now above key moving averages, back within all time highs and a low VIX, monitoring for any pullback to the open gaps and or nearby 10/50 moving averages to the downside would be prudent. The case for higher highs is just as strong and whether you trade the intraday futures or indices ETF’s, momentum clearly resting on the uptrend is a much stronger play.
Swing ETF positions should be careful about chasing at the highs as pullbacks are always opportune times to re-enter the trend as the SPY and QQQ were opportune in week 29.
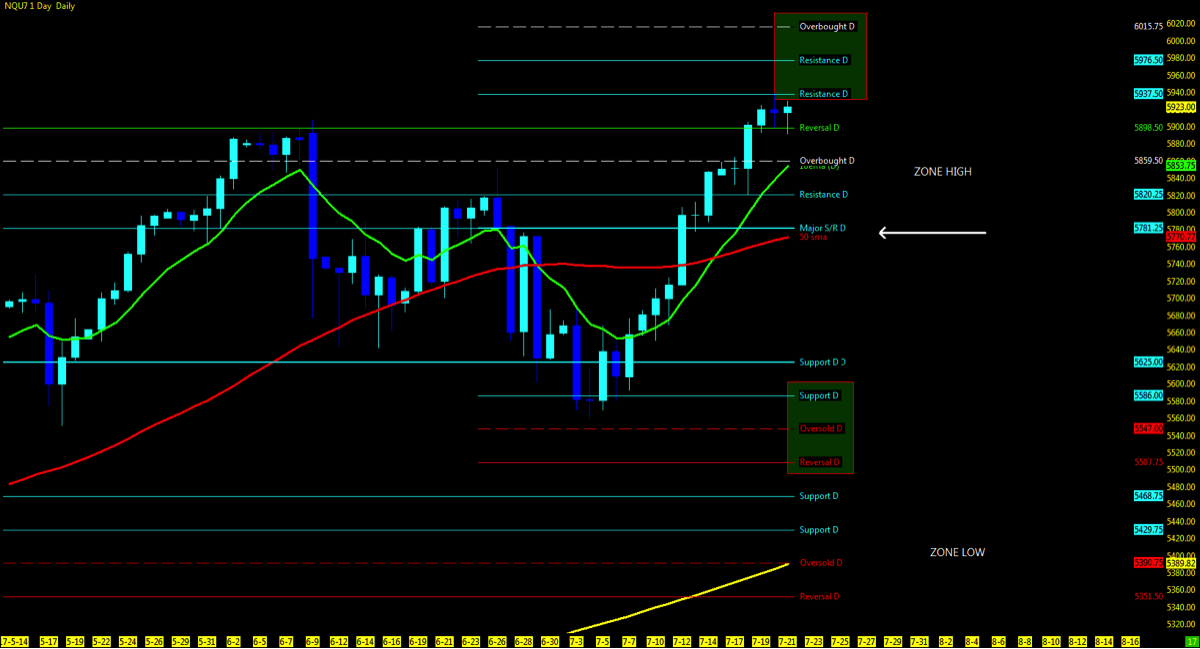
Nasdaq Futures (NQ)
Technical Momentum: UPTREND
Using the Murray Math Level (MML) charts on higher time frames can be a useful market internal tool as price action moves amongst fractal levels from hourly to daily charts. Confluence of levels may be levels of support/resistance or opportunities for a breakout move.
Multiple MML Overlay (DAILY )
- Lowest Open Gap: 4017
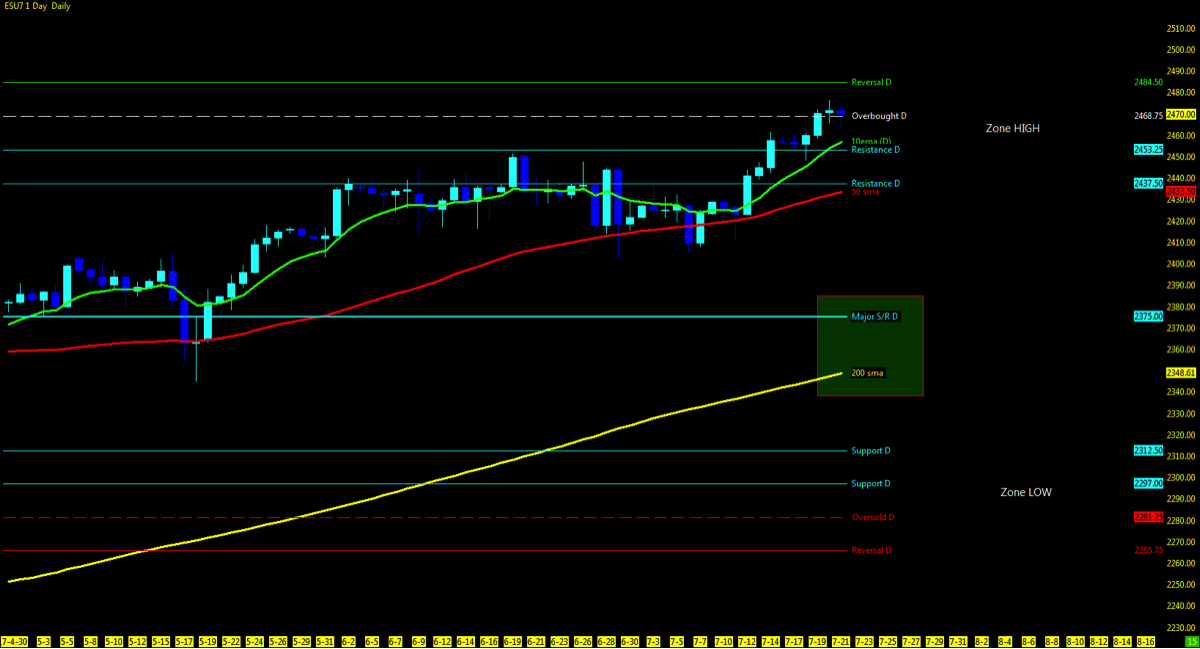
S&P 500 Futures (ES)
Technical Momentum: UPTREND
Multiple MML Overlay (DAILY )
- Lowest Open Gap: 1860.75
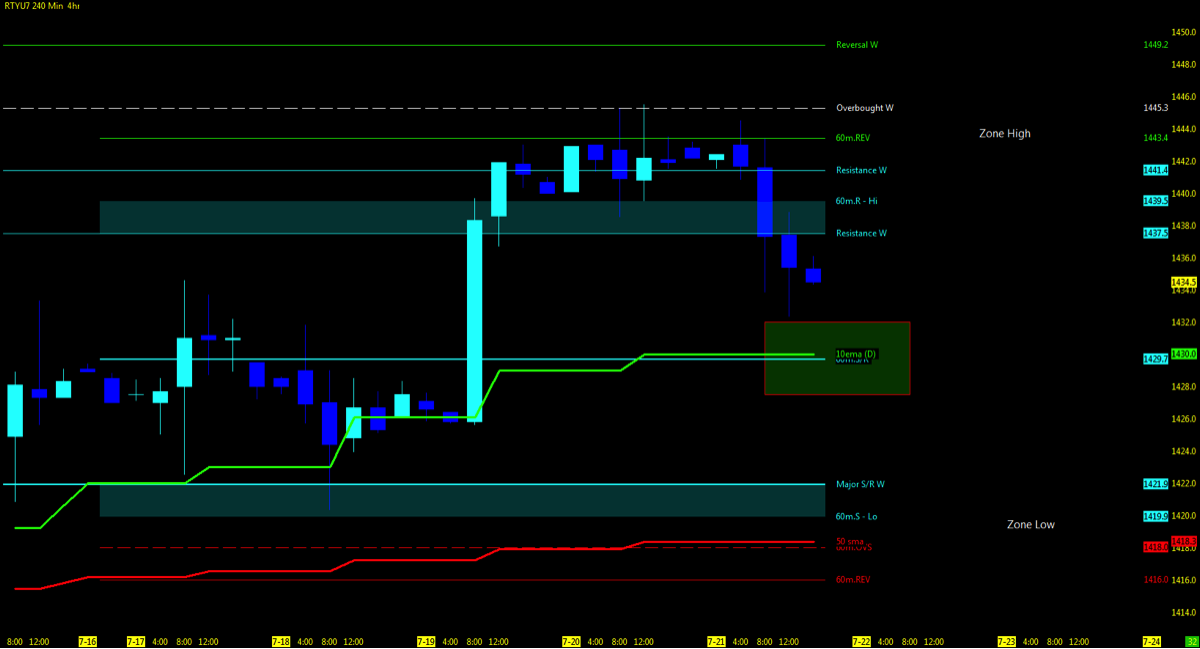
RTY – Russell Futures (CME)
Technical Momentum: UPTREND Consolidation
Multiple MML Overlay (RANGE)
- Lowest Open Gap: NONE
Thanks for reading and remember to always use a stop at/around key technical trend levels.
Twitter: @TradingFibz
The author trades futures intraday and may have a position in the mentioned securities at the time of publication. Any opinions expressed herein are solely those of the author, and do not in any way represent the views or opinions of any other person or entity.


: Showing Some Signs of Emerging Strength")
