S&P 500 Futures Trading Chart and Analysis
MARKET COMMENTARY
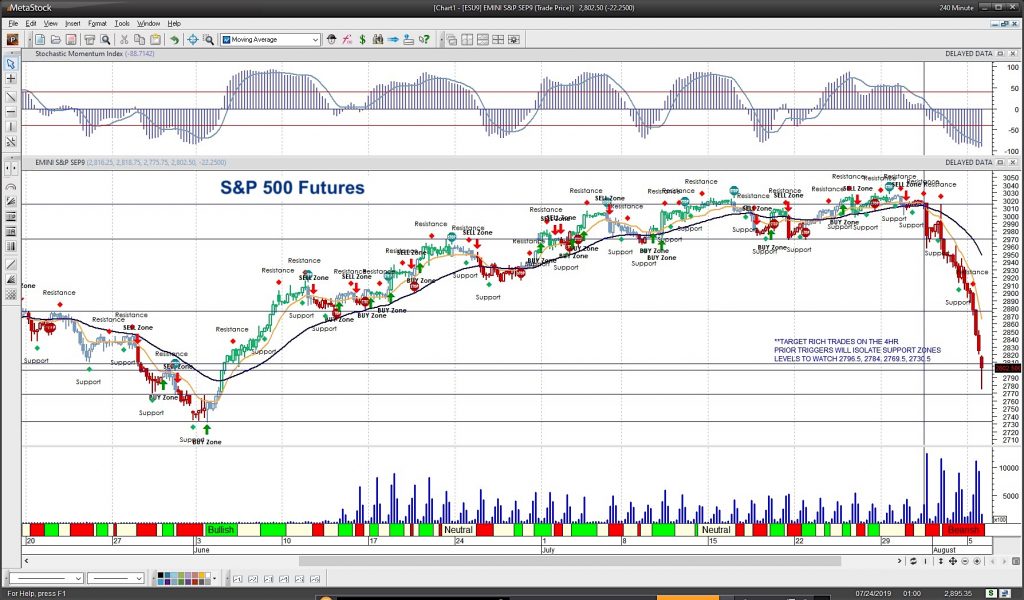
After a steep fade, likely due to a combination of algorithmic trading and fearful traders, China re-pinned the yuan to more favorable levels which coincided with buyers bouncing off the deep supports not seen since early June. A much needed pullback to take some hot air out of the markets.
PRICE ACTION
The e-mini S&P bounced after a deep fade into 2770 which will sit as the support area to watch. Staying above 2861 will be beneficial to buyers trying to recapture control clearly established by sellers yesterday. The mini Nasdaq is now viewing the level near 7620 as resistance but is now working on a 200 point bounce off yesterday’s lows near 7230. The mini DOW broke sharply to test the breakout level near 25000 before also engaging in the current oversold bounce. A negative slant has drifted over the market but from fast moves come failed moves – so a cautionary note about further downside that quickly recovers should be on the mind as possible. In short, however, traders are nervous so prepare for bounces that fail. Only the failure to head lower tells us that traders have stopped their selling.
COMMODITY WATCH
Gold has stalled and is under some technical divergence near 1475. That negative divergence has not given us any deep pullbacks as traders continue to flock to gold. The levels near 1452-1446 could give us low risk higher yield for entering here but so far traders have not allowed it to dip that low. Currency moves continue at the forefront of the markets this week and over the coming months. The USD index fell like a stone near its high into 99. China was the primary one to engage in the ‘tit for tat’ behavior and that shook the markets quite dramatically. WTI is range bound once again holding well between 57.16 and 54.6 –even after stretching out on either side of this range, it remains locked in a channel.
INTRADAY RECAP
Bearish slant as we bounce off deep support. The levels and range between 2861 to 2881 is the watch data for the e-mini S&P resistance with 2843-2824 as support. The mini Nasdaq is within the range between 7460 resistance and 7272 support. Continue to be careful here on the edges of your charts as we could accelerate out and continue if traders get too heavy on the edges.
OVERALL
Divergent action still sits below the movement of price on both sides of the trades – long and short – but traders are still looking at deep support edges to bounce. They are currently failing in this endeavor as we search for stabilizing support below.
Twitter: @AnneMarieTrades
The author trades stock market futures every day and may have a position in mentioned securities at the time of publication. Any opinions expressed herein are solely those of the author, and do not in any way represent the views or opinions of any other person or entity.

: Worrisome to Broader Market?")


