Stock Market Trading Considerations For October 24, 2017
Stock are trading sideways after seeing some selling pressure yesterday. The S&P 500 (INDEXSP:.INX) is likely to test key short-term price support today and how buyers react at those levels will be telling.
Check out today’s economic calendar with a full rundown of releases. And note that the charts below are from our premium service and shared exclusively with See It Market readers.
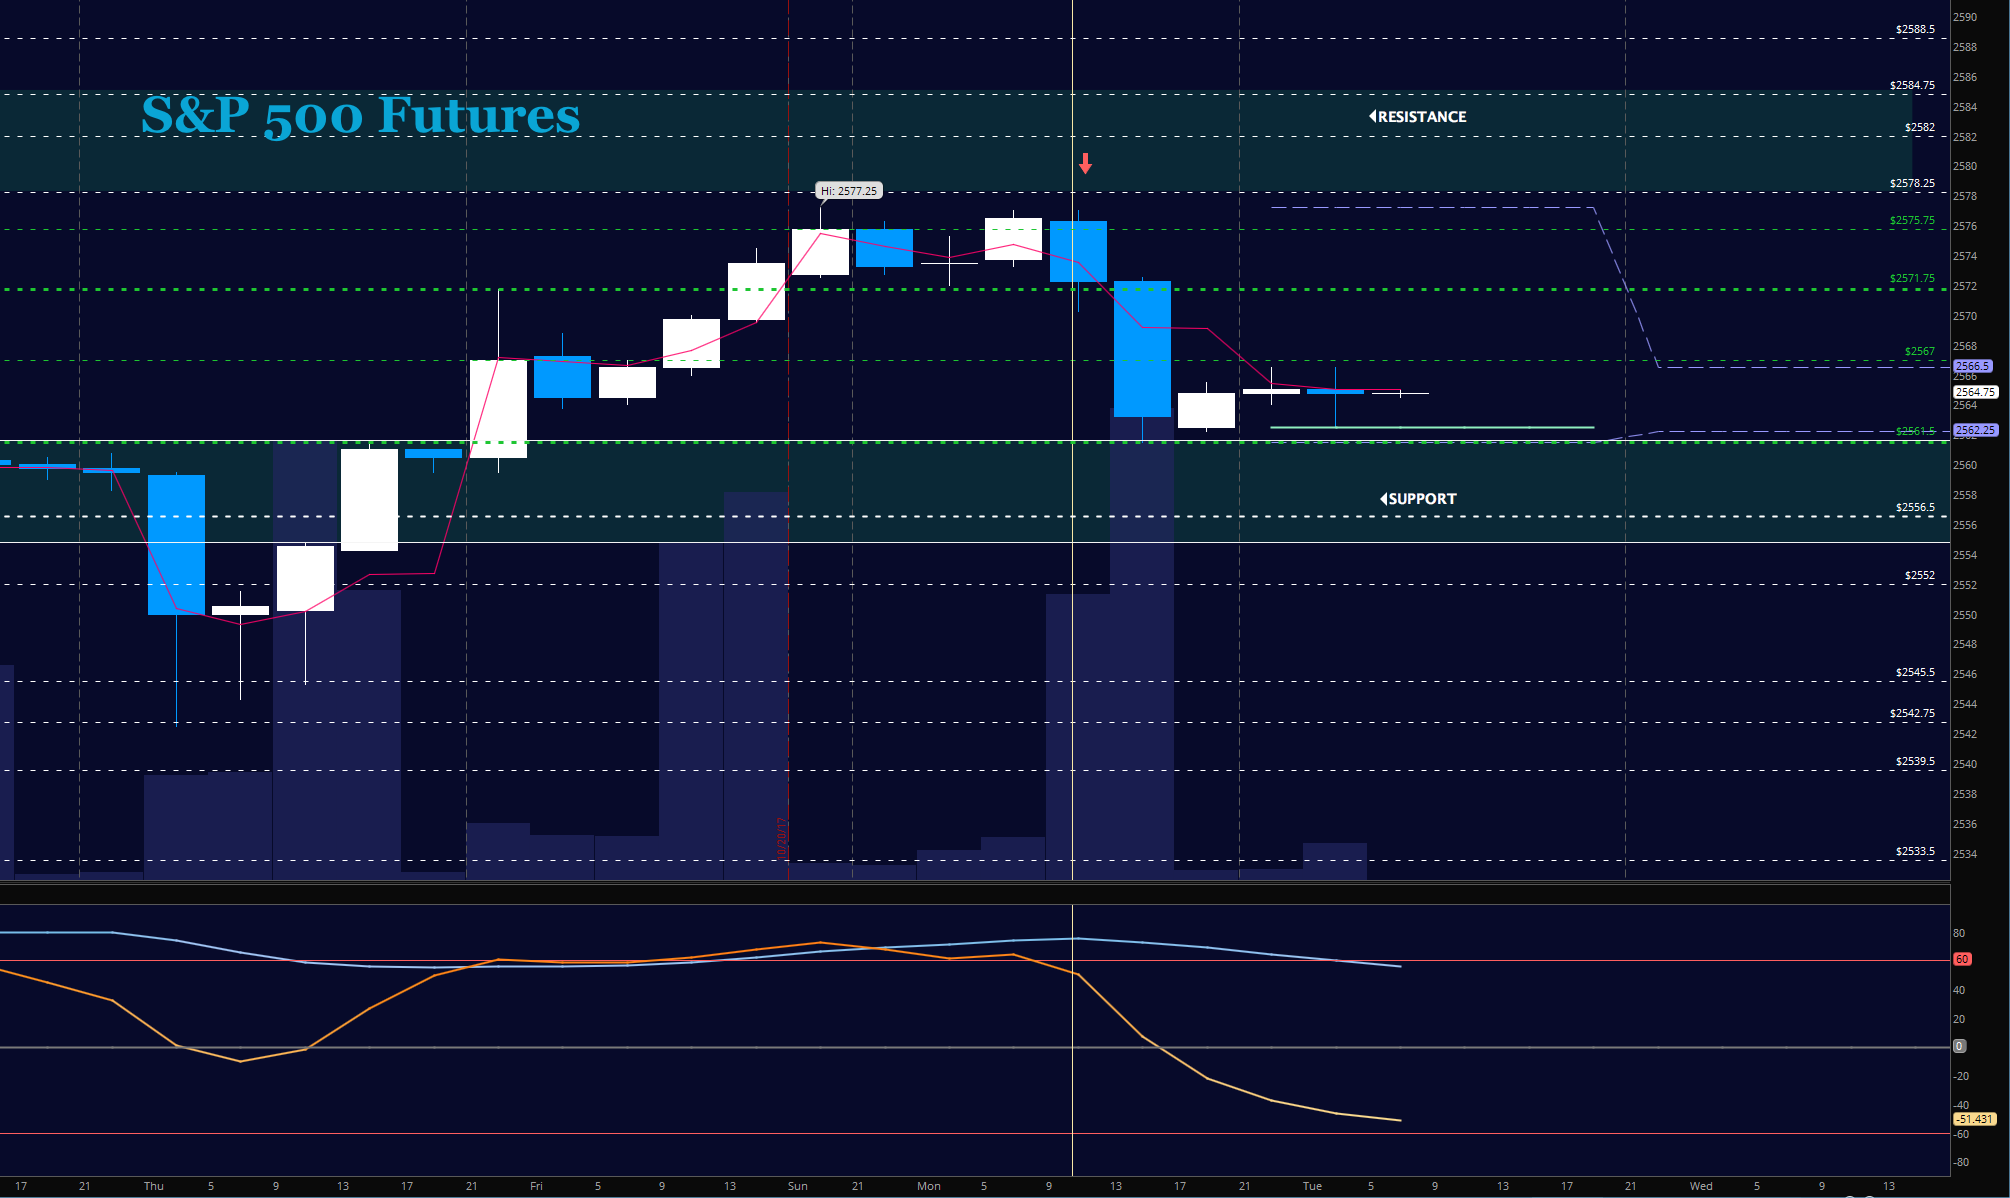
S&P 500 Futures (ES)
Support at 2571 quickly failed and did not recover after several tests on smaller time frames. By 1pm ET, the level 2572 became resistance sturdy enough to trade short. Buyers have typically come to the rescue here, but charts feel a little different, so I am looking for a bounce up that fails to recapture this key level near 2571 to stage a reversal short trade. The bullets below represent the likely shift of trading momentum at the positive or failed retests at the levels noted.
- Buying pressure intraday will likely strengthen above a positive retest of 2572.75
- Selling pressure intraday will likely strengthen with a failed retest of 2561.5
- Resistance sits near 2567.25 to 2571.75, with 2574.75 and 2577.25 above that.
- Support holds between 2562.25 and 2556.5, with 2554.25 and 2549.5 below that.
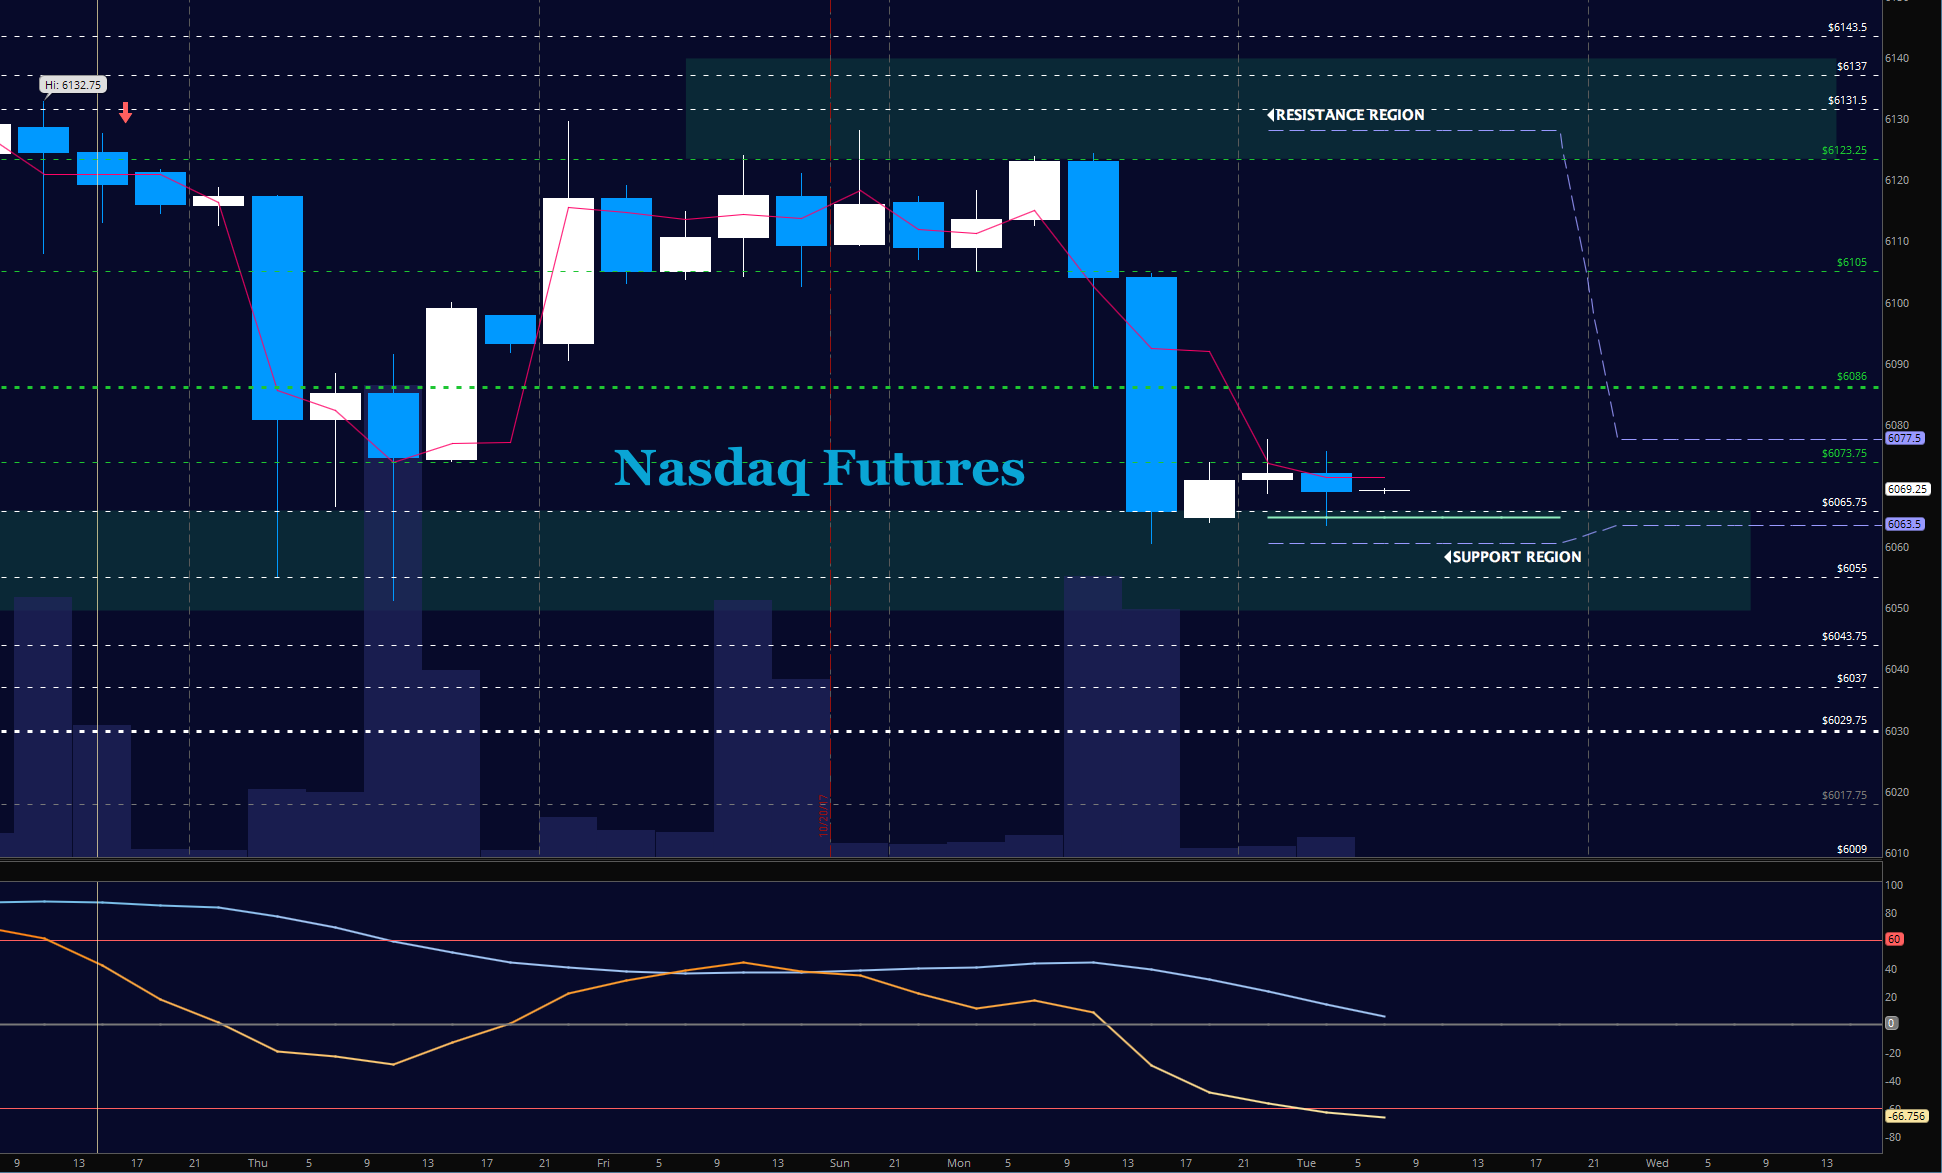
NASDAQ Futures (NQ)
The NQ faded sharply after losing our critical area of 6118 yesterday and has yet to recover the important support zone near 6084. This chart is oddly underperforming into tech heavy earnings this week, as traders rebalance their exposure the broad tech index here. Bounces seem likely to fail at the first pass into the tests of old support levels. The bullets below represent the likely shift of intraday trading momentum at the positive or failed tests at the levels noted.
- Buying pressure intraday will likely strengthen with a positive retest of 6086.5
- Selling pressure intraday will likely strengthen with a failed retest of 6061.5
- Resistance sits near 6084.25 to 6091.5 with 6100.5 and 6117.5 above that.
- Support holds between 6063 and 6055, with 6043.75 and 6029.75 below that.
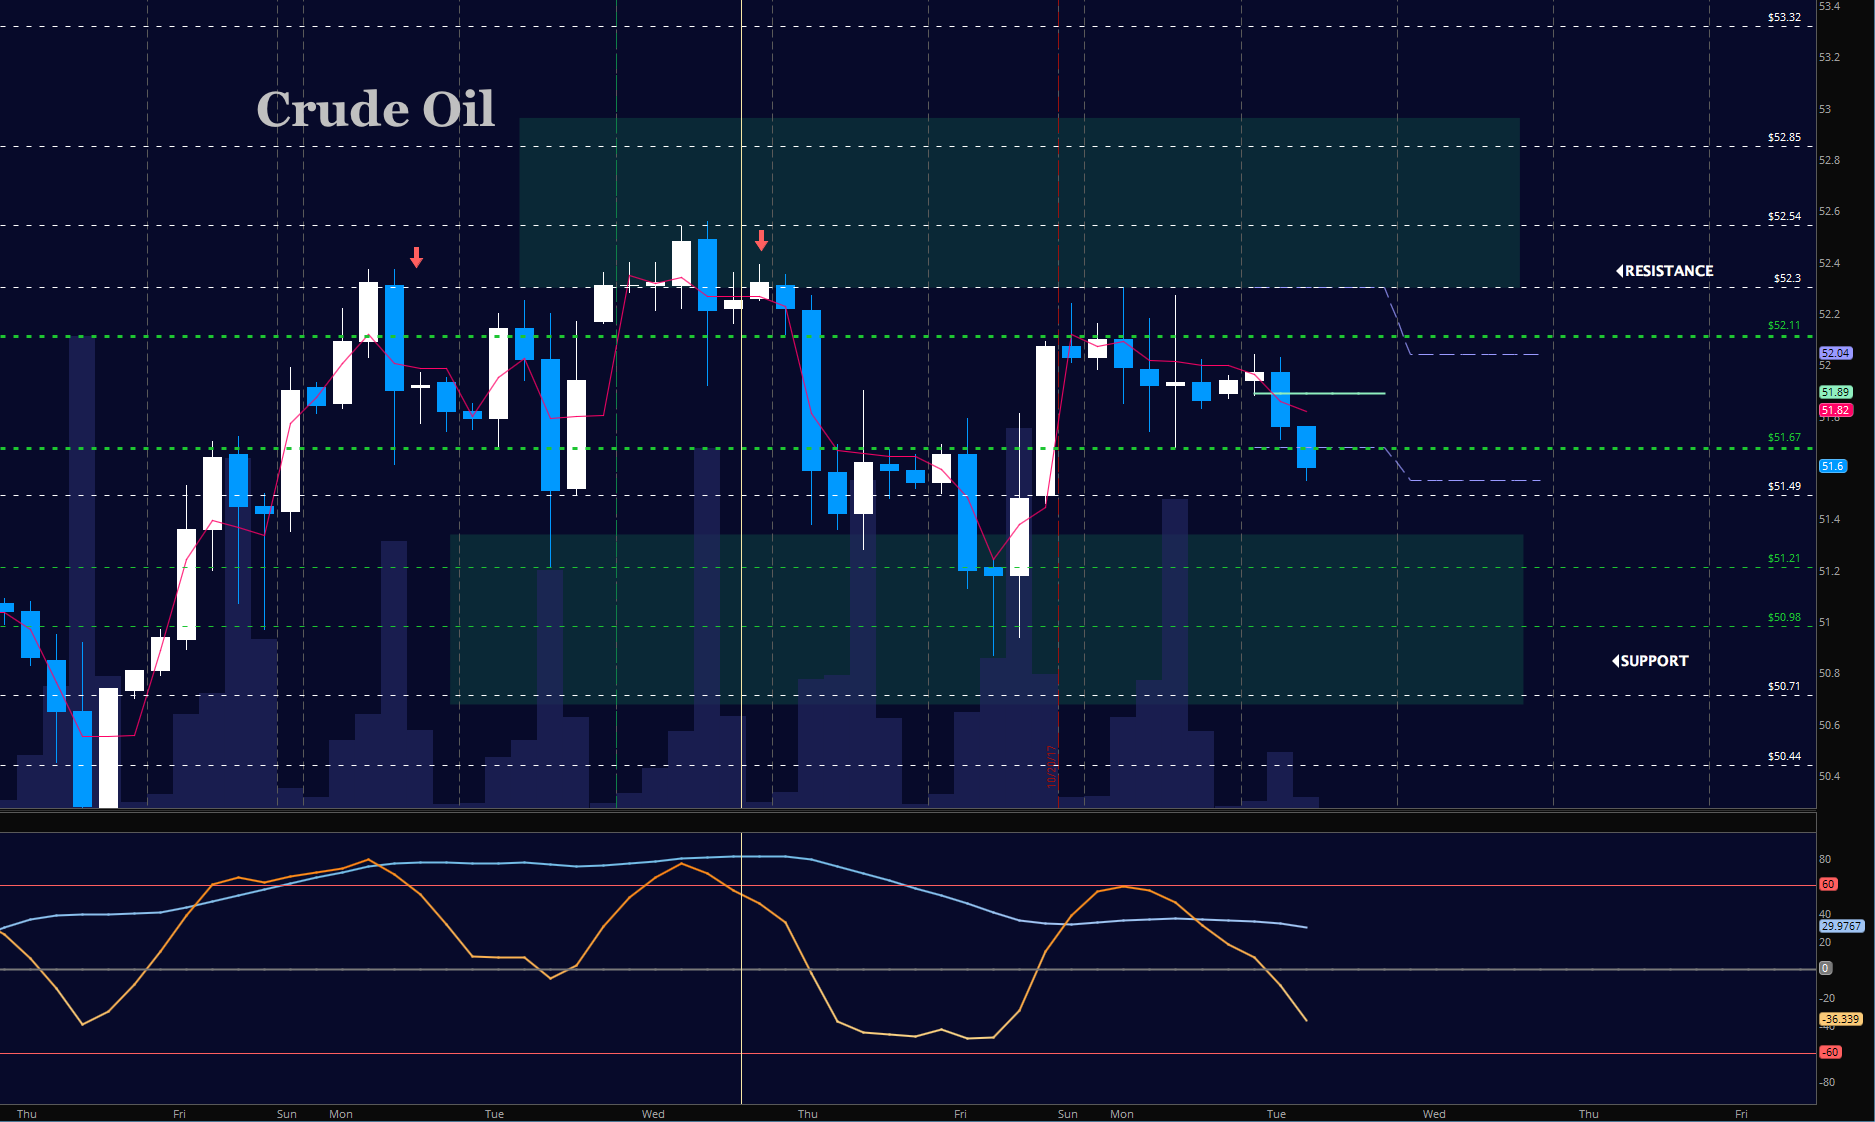
WTI Crude Oil
The API report is out after the close today as oil remains range bound with tests above 52.2 still failing as support holds higher near 51.4. Momentum still shows as mixed between buyers and sellers – with buyers having a slight edge making deeper fades to support as good risk events to take long positions. The bullets below represent the likely shift of trading momentum at the positive or failed tests at the levels noted.
- Buying pressure intraday will likely strengthen with a positive retest of 52.27
- Selling pressure intraday will strengthen with a failed retest of 51.67
- Resistance sits near 52.17 to 52.3, with 52.54 and 53.35 above that.
- Support holds between 51.67 to 51.37, with 50.98 and 50.16 below that.
If you’re interested in the live trading room, it is now primarily stock market futures content, though we do track heavily traded stocks and their likely daily trajectories as well – we begin at 9am with a morning report and likely chart movements along with trade setups for the day.
As long as the trader keeps himself aware of support and resistance levels, risk can be very adequately managed to play in either direction as bottom picking remains a behavior pattern that is developing with value buyers and speculative traders.
Twitter: @AnneMarieTrades
The author trades stock market futures every day and may have a position in mentioned securities at the time of publication. Any opinions expressed herein are solely those of the author, and do not in any way represent the views or opinions of any other person or entity.


 May Tip Stock Market’s Next Move")
