Stock Market Futures Trading Considerations For June 21, 2017
The S&P 500 (INDEXSP:.INX) took a hit yesterday as sellers pushed the market to lower support levels. However, this pullback is finding buyers as we start the morning trading session.
Check out today’s economic calendar with a full rundown of releases. And note that the charts below are from our premium service and shared exclusively with See It Market readers.
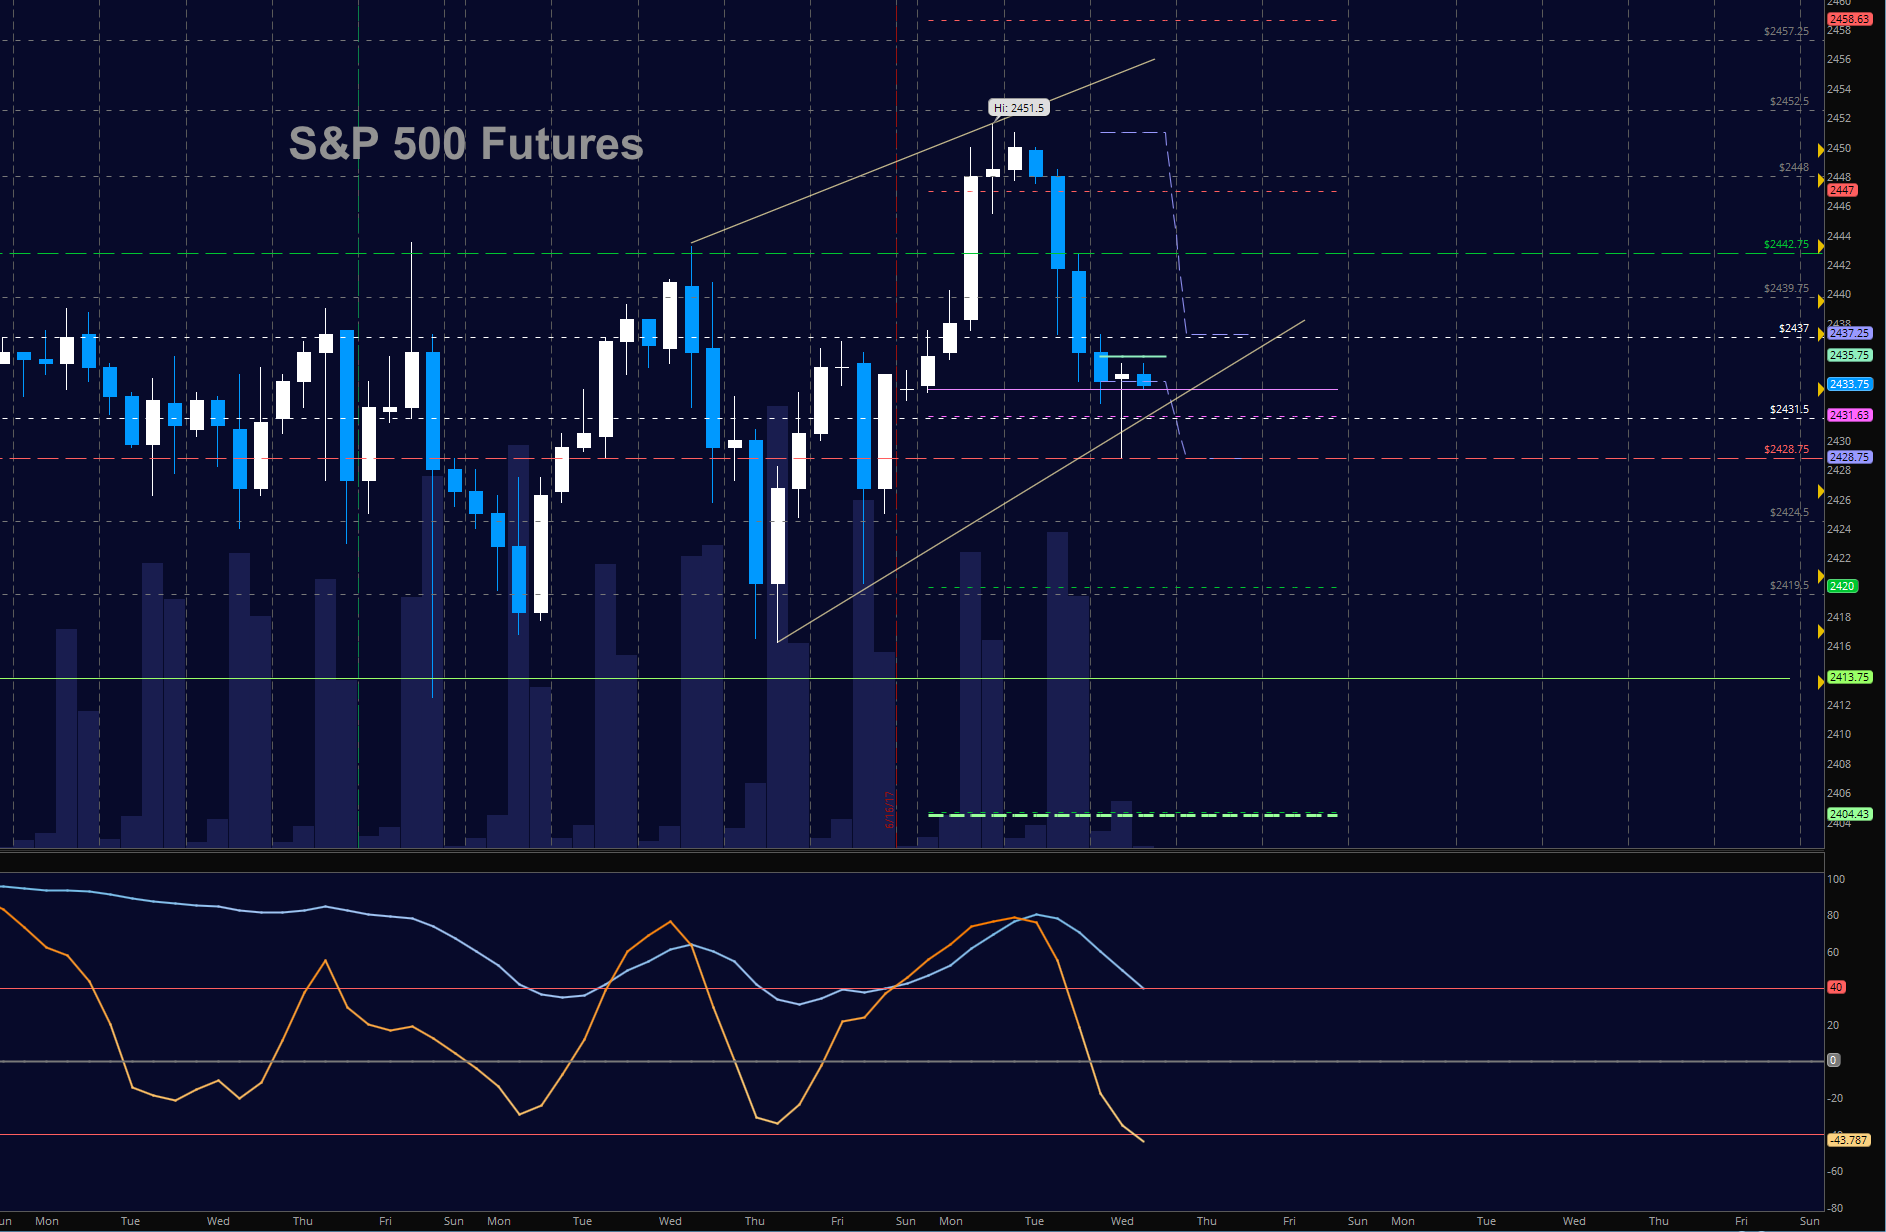
S&P 500 Futures (ES)
Pullbacks will see buyers today. Range bound motion continues this morning as we approach resistance once more. Making higher lows important for bulls. The bullets below represent the likely shift of trading momentum at the positive or failed retests at the levels noted.
- Buying pressure intraday will likely strengthen above a positive retest of 2438
- Selling pressure intraday will likely strengthen with a failed retest of 2428.75
- Resistance sits near 2442.5 to 2448.5, with 2451.5 and 2454.5 above that,
- Support holds between 2428 and 2424.25, with 2419.5 and 2413.5 below that.
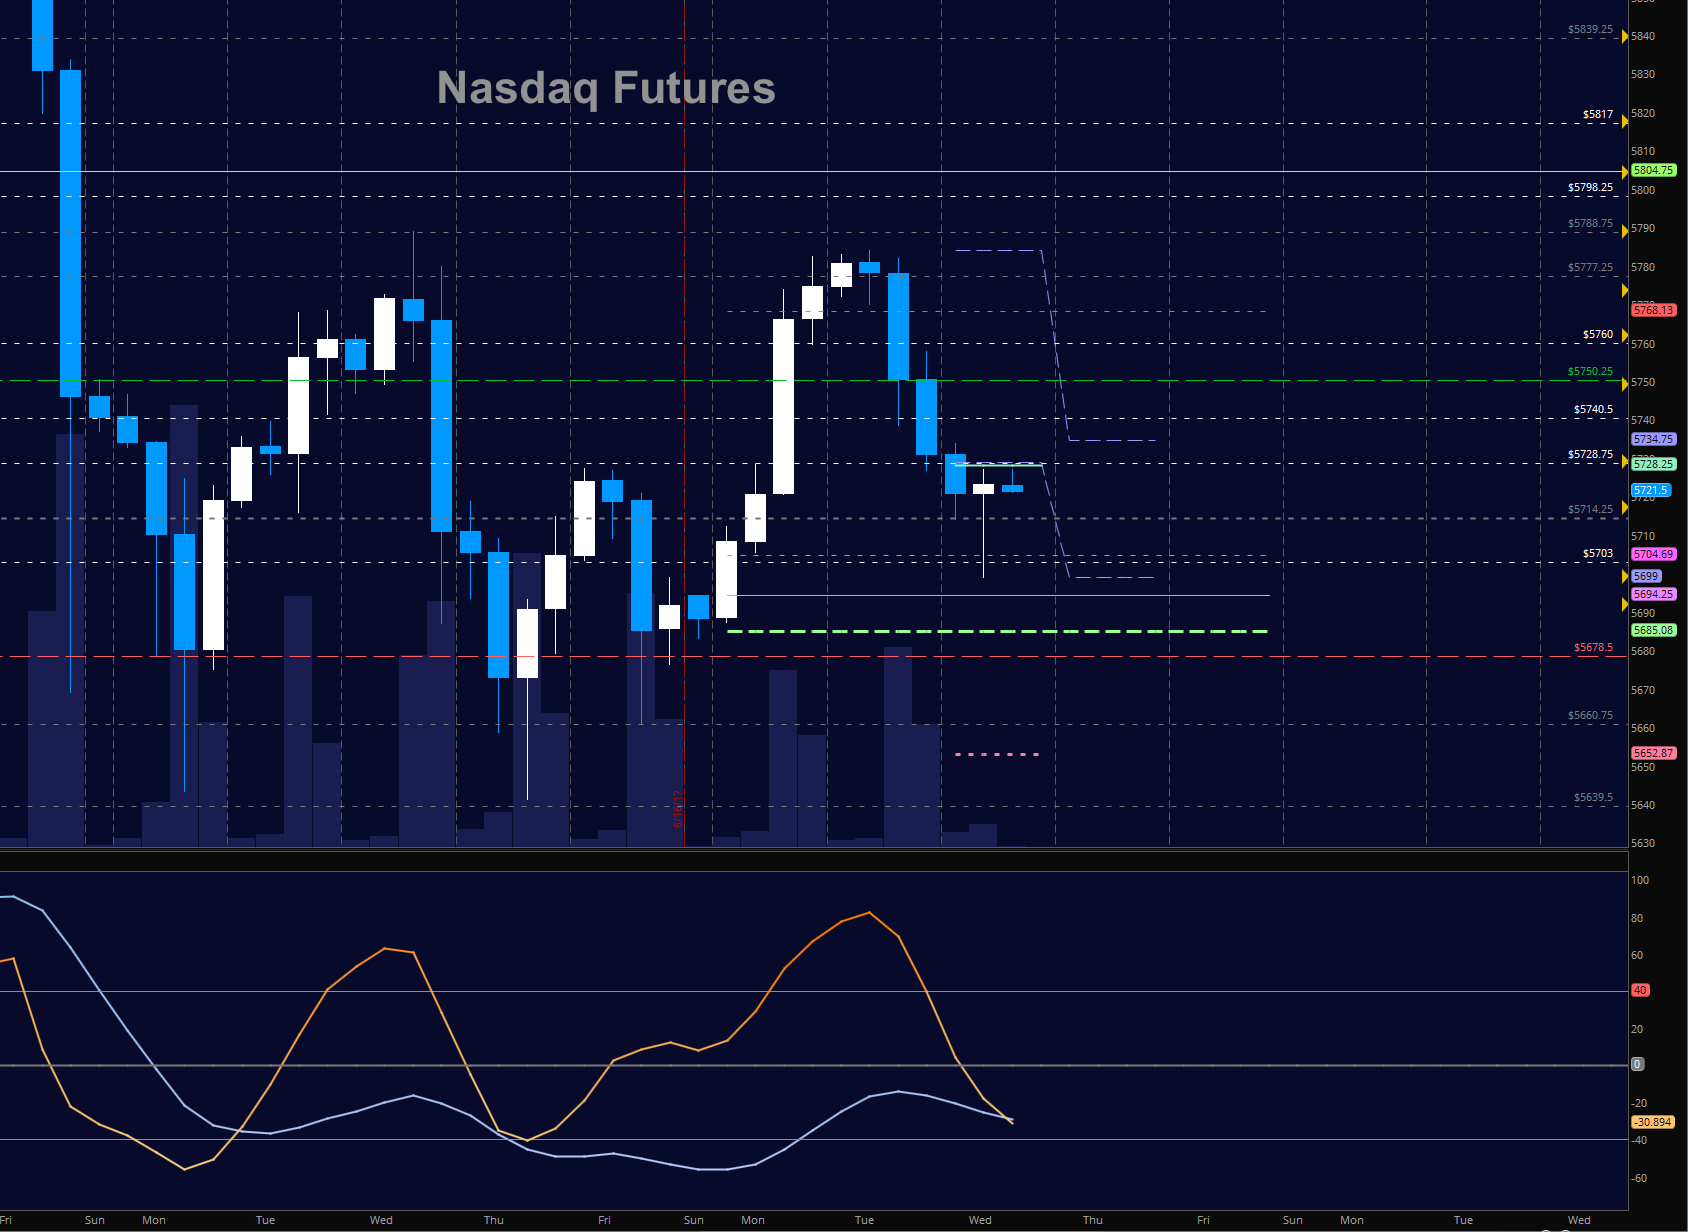
NASDAQ Futures
Tech faded like the others, still showing as the weakest of the group. We see new resistance at 5728.75, and then again at 5750.25. Traders are likely to attempt recovery in this chart today, but the failure to hold 5716 will make recovery quite difficult. The bullets below represent the likely shift of intraday trading momentum at the positive or failed tests at the levels noted.
- Buying pressure intraday will likely strengthen with a positive retest of 5729
- Selling pressure intraday will likely strengthen with a failed retest of 5703.25
- Resistance sits near 5728.75 to 5750.25, with 5760.5 and 5777.5 above that.
- Support holds between 5716.25 and 5703.5, with 5690.25 and 5684.75 below that.
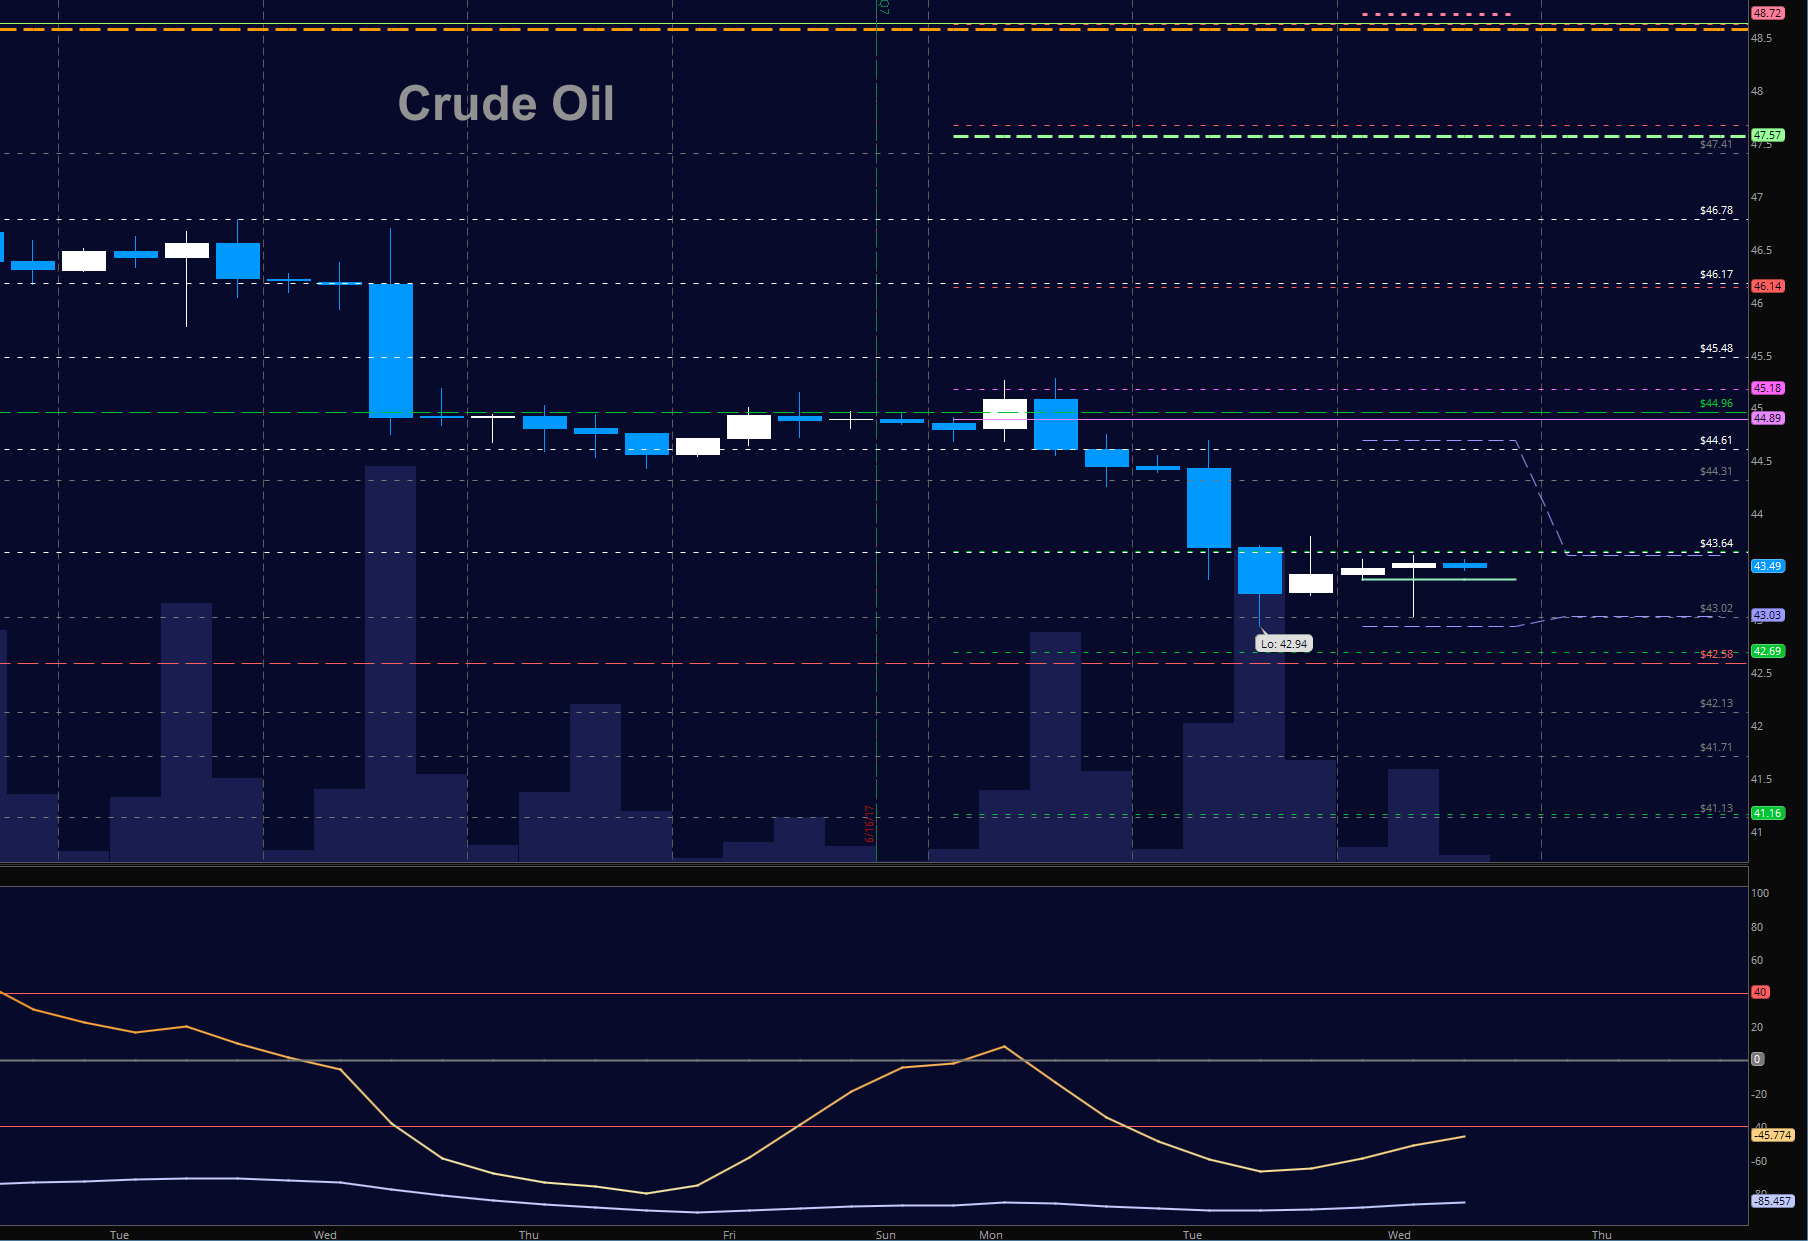
WTI Crude Oil
We hold steady for now after a fade to test 43, and now sit at resistance near 43.64. A Fibonacci formation projects a fade into 41 or so, but it is still much better to short at resistance rather than expose capital to risk events that are clearly visible. The levels near 44.3 to 44.6 sit as resistance for now. The EIA report may provide a ‘rip cord’ space for trapped buyers. Buyers are likely to attempt a move above 44.6, but below that sellers are clearly in charge, and bounces will very likely fall into lower levels. The bullets below represent the likely shift of trading momentum at the positive or failed tests at the levels noted.
- Buying pressure intraday will likely strengthen with a positive retest of 44.31
- Selling pressure intraday will strengthen with a failed retest of 43.01
- Resistance sits near 43.7 to 44.31, with 44.6 and 444.89 above that.
- Support holds between 44.3 to 44.17, with 43.65 and 43.07 below that.
If you’re interested in watching these trades go live, join us in the live trading room from 9am to 11:30am each trading day. Visit TheTradingBook for more information.
If you’re interested in the live trading room, it is now primarily stock market futures content, though we do track heavily traded stocks and their likely daily trajectories as well – we begin at 9am with a morning report and likely chart movements along with trade setups for the day.
As long as the trader keeps himself aware of support and resistance levels, risk can be very adequately managed to play in either direction as bottom picking remains a behavior pattern that is developing with value buyers and speculative traders.
Twitter: @AnneMarieTrades
The author trades stock market futures every day and may have a position in mentioned securities at the time of publication. Any opinions expressed herein are solely those of the author, and do not in any way represent the views or opinions of any other person or entity.

: Creating Bullish Divergence?")


: Creating Bullish Divergence?")

