Market Futures Overview & Considerations For October 27, 2017
The S&P 500 (INDEXSP:.INX) and Nasdaq (INDEXNASDAQ:.IXIC) could breakout above short-term price resistance today, and march to new all-time highs. Tech earnings were strong. How buyers react to these breakouts and any subsequent pullbacks will be important…
Check out today’s economic calendar with a full rundown of releases. And note that the charts below are from our premium service and shared exclusively with See It Market readers.
S&P 500 Futures
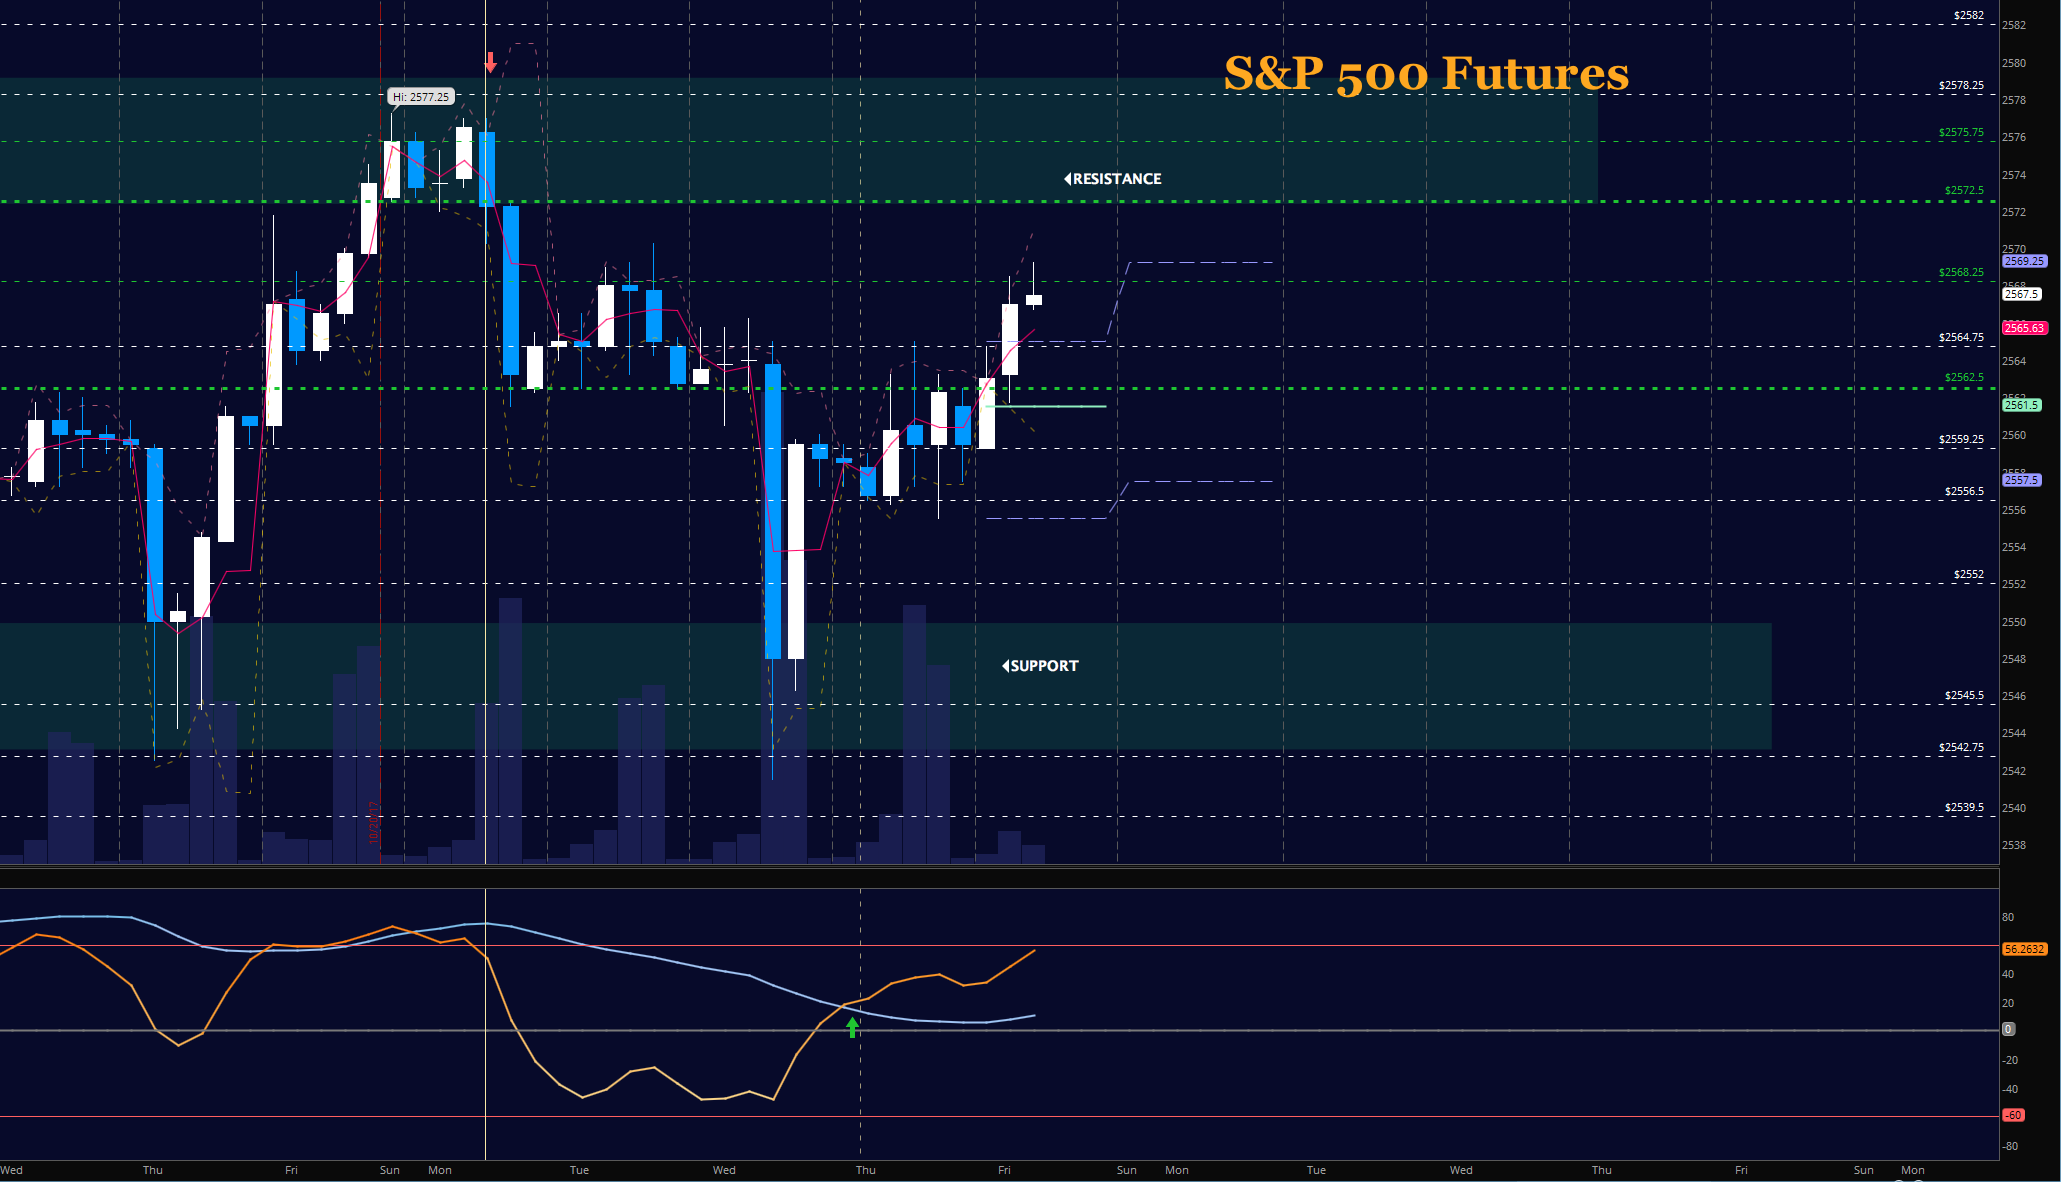
Buyers rebound into Tuesday’s resistance and have stalled out. The hold above 2569 gives the buyers a chance to completely recover. Pullbacks to higher lows will hold unless we lose 2556 – a battleground. The bullets below represent the likely shift of trading momentum at the positive or failed retests at the levels noted.
- Buying pressure intraday will likely strengthen above a positive retest of 2574.75
- Selling pressure intraday will likely strengthen with a failed retest of 2559.5
- Resistance sits near 2569.5 to 2572.75, with 2574.75 and 2578.25 above that.
- Support holds between 2561 and 2555, with 2552.25 and 2544.5 below that.
NASDAQ Futures
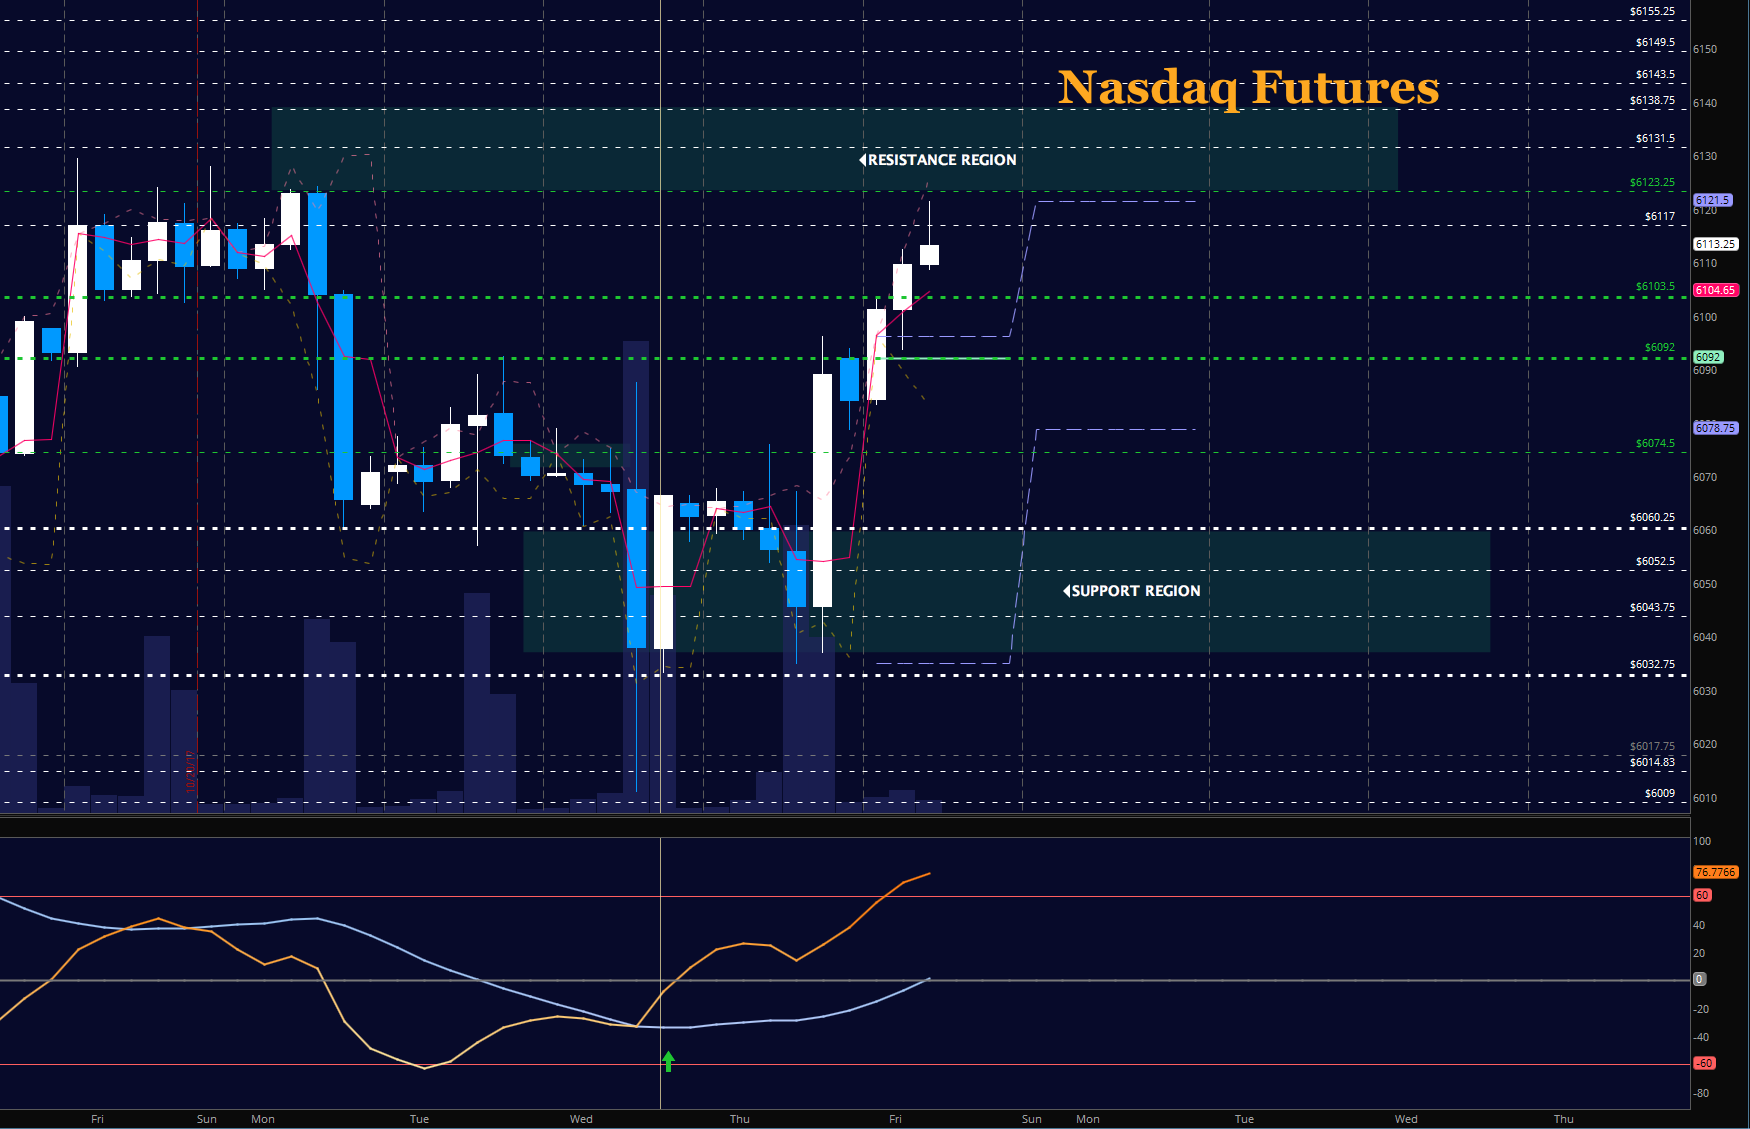
The NQ recovered in an equally aggressive and has recovered all of the drift down to stall again near highs at the beginning of the week. The levels near 6120, old resistance, are being rejected. Support now holds at 6078.5. Below 6057, sellers will be more aggressive. Participation on either side of the trades in here requires much wider stops. The bullets below represent the likely shift of intraday trading momentum at the positive or failed tests at the levels noted.
- Buying pressure intraday will likely strengthen with a positive retest of 6123.5
- Selling pressure intraday will likely strengthen with a failed retest of 6103.5
- Resistance sits near 6117.25 to 6123.5 with 6132.75 and 6143.5 above that.
- Support holds between 6106.5 and 6094.5, with 6078.75 and 6060.75 below that.
WTI Crude Oil
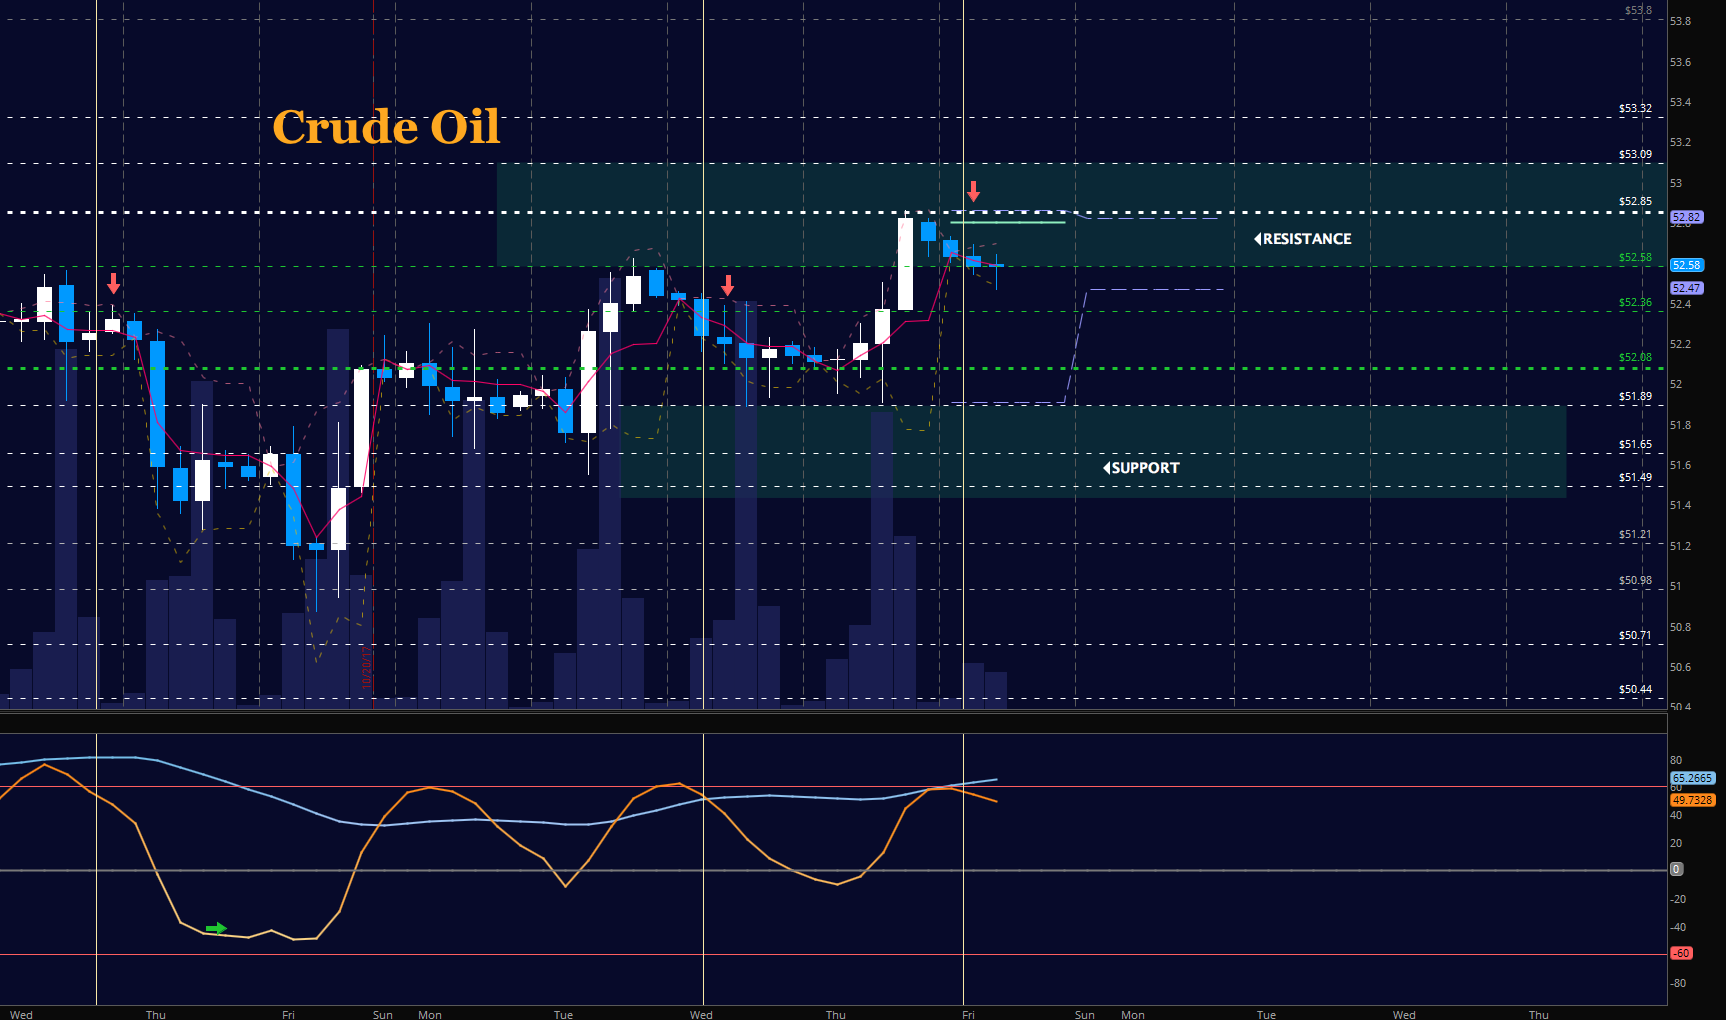
Oil has finally broken out and hit our first strong resistance of 52.85. It is now on its way to test 52.36. Momentum still shows as more bullish. The bullets below represent the likely shift of trading momentum at the positive or failed tests at the levels noted.
- Buying pressure intraday will likely strengthen with a positive retest of 52.66
- Selling pressure intraday will strengthen with a failed retest of 51.9
- Resistance sits near 52.6 to 52.85, with 553.09 and 53.32 above that.
- Support holds between 52.47 to 52.08, with 51.74 and 51.20 below that.
If you’re interested in the live trading room, it is now primarily stock market futures content, though we do track heavily traded stocks and their likely daily trajectories as well – we begin at 9am with a morning report and likely chart movements along with trade setups for the day.
As long as the trader keeps himself aware of support and resistance levels, risk can be very adequately managed to play in either direction as bottom picking remains a behavior pattern that is developing with value buyers and speculative traders.
Twitter: @AnneMarieTrades
The author trades stock market futures every day and may have a position in mentioned securities at the time of publication. Any opinions expressed herein are solely those of the author, and do not in any way represent the views or opinions of any other person or entity.


 May Tip Stock Market’s Next Move")


