S&P 500 Broad Market Overview for January 6, 2017
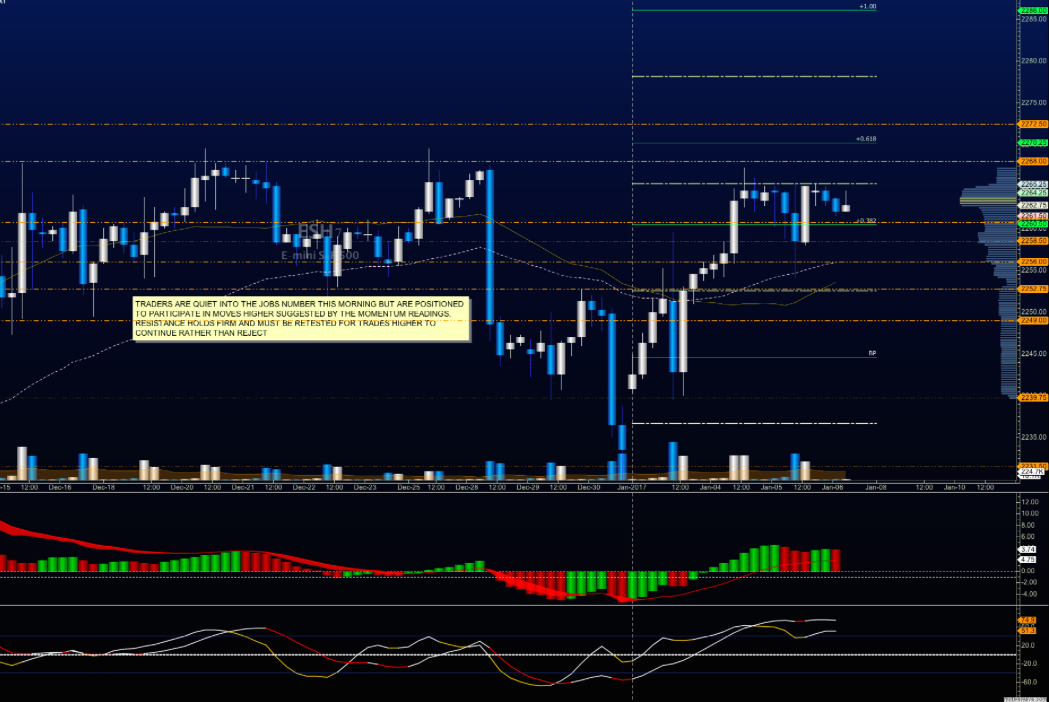
Traders are reacting to the morning jobs data release. With buyers pressing support higher, it seems that the S&P 500 (INDEXSP:.INX) is on track to break further north. I am concerned that the volume is not increasing with increasing price. If continued, this suggests that we will fail to hold the breakout levels. Stock market momentum readings also suggest this.
Buying pressure will likely strengthen on a move above 2266 on S&P 500 futures. Selling pressure will strengthen with a failed retest of 2257. Price resistance sits near 2265.75 to 2269.25, with 2272.75 and 2274.5 above that. Price support holds between 2254- 2249 with a failed test of 2257.
See today’s economic calendar with a rundown of releases.
TODAY’S RANGE OF MOTION
E-mini S&P 500 Futures Trading Chart For January 6
Upside trades – Two options for entry
Positive retest of continuation level – 2265.5
Positive retest of support level – 2257.25
Opening targets ranges – 2260.75, 2264.25, 2266, 2268.25, 2271.25, 2272.75, 2275.50, 2278.25 and 2282.50
Downside trades – Two options for entry
Failed retest of resistance level – 2260.5
Failed retest of support level – 2258 (Watch for 2254 and 2257 to potentially provide buying pressure)
Opening target ranges – 2258.75, 2256.75, 2252.75, 2249.75, 2246.50, 2242.75, 2239, 2235, 2231.50, 2227.75, 2224.25, and 2221.75
Nasdaq Futures
The NQ_F chart continues to look quite bullish as it holds 4958 as support. Traders are reversing the move down from the 4978.50 regions. Pullbacks should be bought in the current formation, but I am watching for possible exhaustion.
Buying pressure will likely strengthen above 4968 in the current formation, though I am concerned about exhaustion. Selling pressure will strengthen with a failed retest of 4951. Price resistance sits near 4967.75 to 4978.5, with 4985 and 4994 above that. Price support holds between 4941 and 4936 with a failed test of 4951.
Upside trades – Two options
Positive retest of continuation level – 4968 (needs confirmation on tight time frame)
Positive retest of support level – 4954.5 (also needs confirmation)
Opening target ranges –4959, 4962.25, 4966.5, 4973.25, 4978.25, 4988.25, 4994, 4997, and 5002.25
Downside trades- Two options
Failed retest of resistance level -4960(watch for congestion or a hold of 4955)
Failed retest of support level – 4952.5 (watch for buyers near 4948 and 4946)
Opening target ranges –4955.75, 4954.5, 4949.25, 4945.75, 4941, 4937.75, 4932.25, 4927.5, 4924.5, 4921.50, 4919, 4916.50, 4912.25, 4909.50, 4906.25, 4902.25, 4897, 4891.75, and 4885.25
Crude Oil –WTI
With OPEC production cuts in play, traders are pressing price forward into higher resistance levels. Buyers are forcing higher lows as they attempt to recover losses from Tuesday’s sharp drift lower.
Buying pressure will likely strengthen above 54.3 in the current formation, though I am concerned about exhaustion here also (short term). Selling pressure will strengthen with a failed retest of 53.4. Price resistance sits near 54.51 to 54.7, with 54.76 and 55.08 above that. Price support holds between 53.3 and 53.03 with a failed test of 53.67.
Upside trades – Two options
Positive retest of continuation level – 54.35 (needs confirmation)
Positive retest of support level – 53.73
Opening target ranges – 53.86, 54.18, 54.35, 54.51, 54.73, 55.06, 55.24, 55.34, 55.7, 56.05, and 56.5
Downside trades – Two options
Failed retest of resistance level – 54.22
Failed retest of support level – 53.67 (watch support near 53.46 if the chart breaks through the high early in the day)
Opening target ranges – 54.07, 53.84, 53.66, 53.4, 53.23, 53.03, 52.78, 52.51, 52.32, 52.12, 51.82, 51.56, 51.3, and 51.12
If you’re interested in watching these trades go live, join us in the live trading room from 9am to 11:30am each trading day.
Visit TheTradingBook for more information.
If you’re interested in the live trading room, it is now primarily stock market futures content, though we do track heavily traded stocks and their likely daily trajectories as well – we begin at 9am with a morning report and likely chart movements along with trade setups for the day.
As long as the trader keeps himself aware of support and resistance levels, risk can be very adequately managed to play in either direction as bottom picking remains a behavior pattern that is developing with value buyers and speculative traders.
Twitter: @AnneMarieTrades
The author trades stock market futures every day and may have a position in mentioned securities at the time of publication. Any opinions expressed herein are solely those of the author, and do not in any way represent the views or opinions of any other person or entity.

: Showing Some Signs of Emerging Strength")
