S&P 500 Trading Considerations For March 2, 2017
A large move under tepid volume pushed the S&P 500 (INDEXSP:.INX) to new highs yesterday. The price action has since receded into higher support. The chart should give us a bounce with buyers anxious about missing out, and potentially double top the formation from a short cycle perspective. Next week, the job report will hold our attention.
The market makers in the S&P 500 Index suspected a move shy of this on the week so the fade to the higher support and then a chop in the space could give us the end of the week. The bottom line is here that I am under the impression from the evidence presented that our move up for the week is essentially over and we will end the week under choppy action.
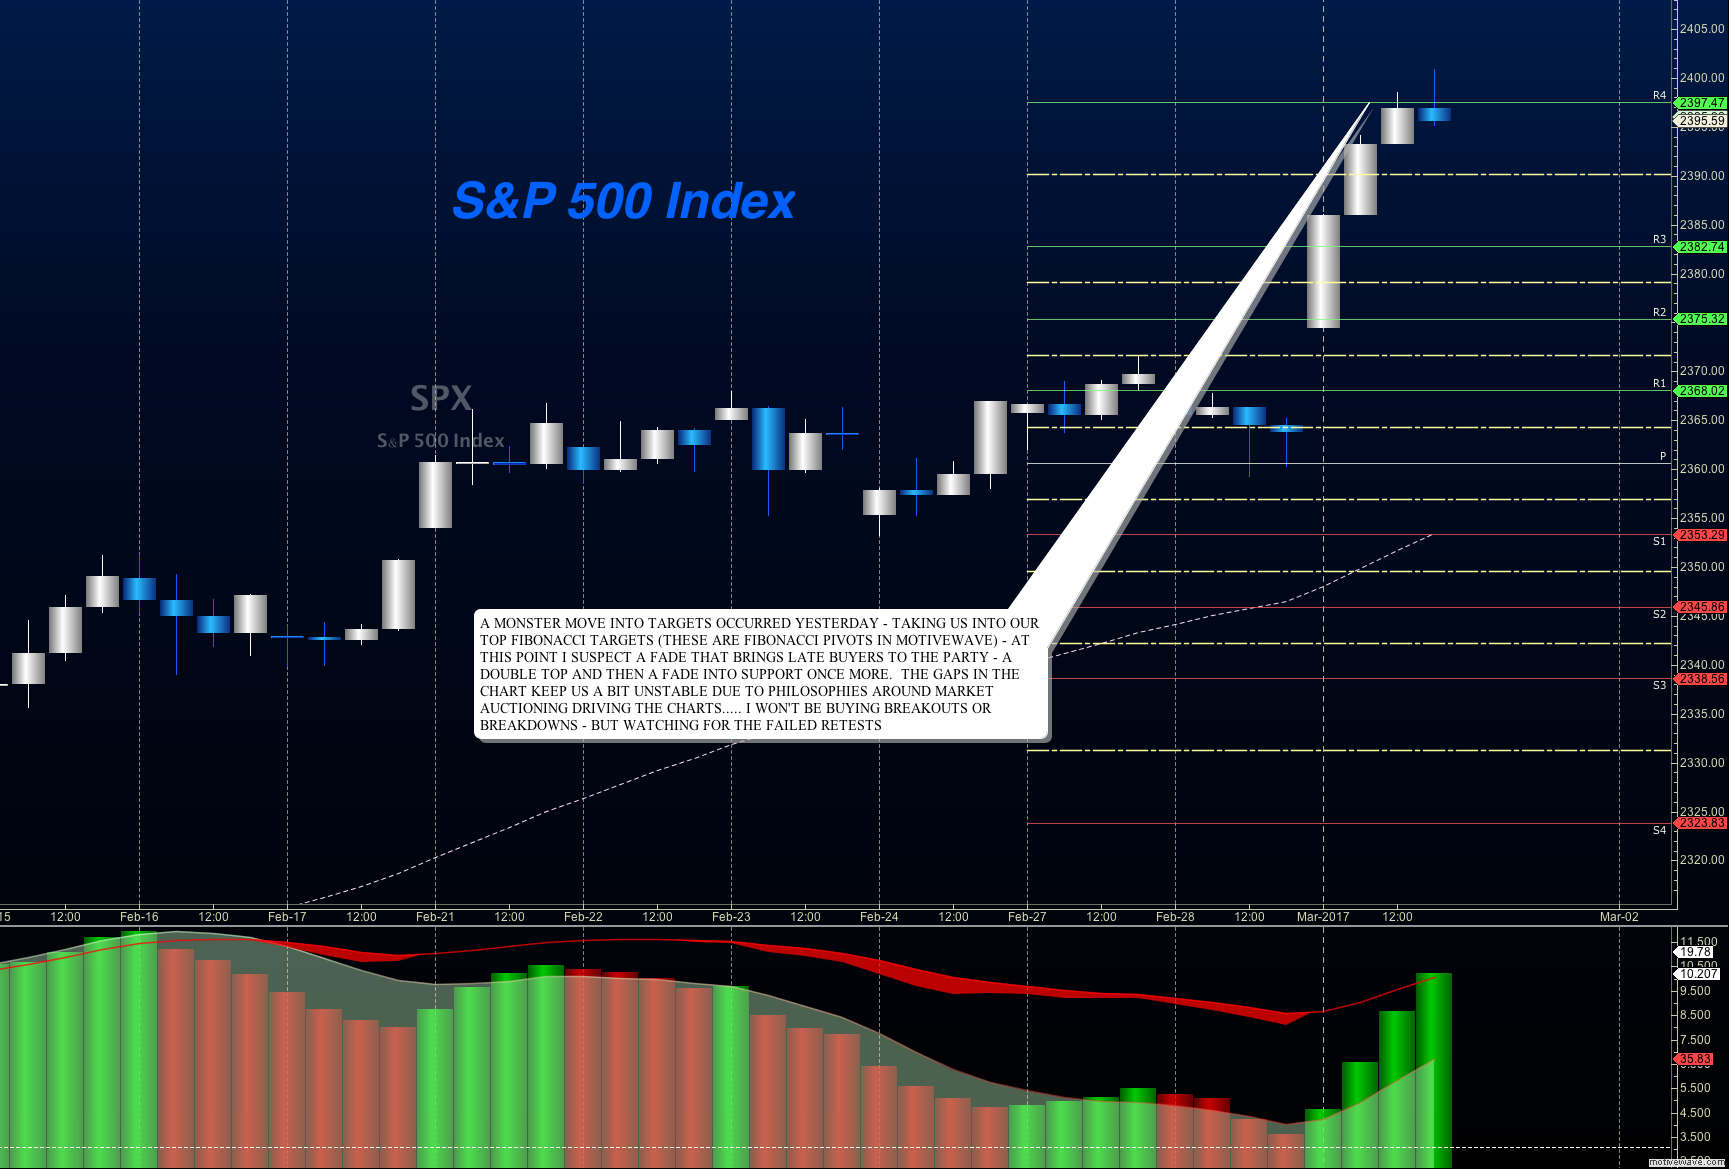
Buying pressure will likely strengthen above a positive retest of 2400.5, while selling pressure will strengthen with a failed retest of 2373.75. Price resistance sits near 2396 to 2401, with 2406.25 and 2411.75 above that. Price support holds between 2377.25 and 2372.75, with 2368 and 2361.5 below that.
See today’s economic calendar with a rundown of releases.
S&P 500 Futures
Upside trades – Two options for entry
- Positive retest of continuation level -2396.5
- Positive retest of support level– 2380.75
- Opening targets ranges – 2383, 2386.5, 2393.5, 2397.75, 2400.5, 2404, 2411.75
Downside trades – Two options for entry
- Failed retest of resistance level -2396.25
- Failed retest of support level– 2388.75
- Opening target ranges – 2392.75, 2388.75, 2385.5, 2381.25, 2376, 2373.5, 2368.75, 2365, 2361.5, 2358.75, 2354.5, 2351.5, 2346.25, 2343.25, 2337.5, 2334, 2329.25
NASDAQ Futures
- Buying pressure will likely strengthen with a positive retest of 5399.75
- Selling pressure will strengthen with a failed retest of 5370
- Resistance sits near 5390 to 5399.75, with 5411.5 and 5422.25 above that
- Support holds between 5378.75 and 5370.75, with 5364.25 and 5356.25 below that
Upside trades – Two options
- Positive retest of continuation level -5389.75
- Positive retest of support level– 5379.75
- Opening target ranges – 5350.5, 5354.5, 5360.25, 5364.5, 5369.75, 5378.75, 5384, 5388.25, 5398, 5404, 5411.5, 5422.25
Downside trades- Two options
- Failed retest of resistance level -5397.75
- Failed retest of support level– 5378.75
- Opening target ranges – 5392.75, 5389.5, 5384.5, 5379.75, 5378.75, 5370.75, 5364.5, 5356.5, 5348.25, 5340.75, 5336.25, 5332, 5327.75, 5323.75, 5320.75, 5318.75, 5311.75, 5306.5, 5297.75, 5294.25, 5291.25, 5286.75, 5277.75
Crude Oil –WTI
Oil traders are sitting at the edge of support regions with heavy momentum. Buyers should try to defend 53.2 to 53.01, with a deeper test of 52.8 possible before another try to recover higher levels. Hedge funds are reported to be positioned long but I suspect hedging in the forward contract is what might be happening to keep the hounds at bay =). Crude oil momentum continues to drift lower but an inflection zone is very likely to be on the horizon. The real question will be- will it bounce into lower highs, or finally breach the congestion.
- Buying pressure will likely strengthen with a positive retest of 54.56
- Selling pressure will strengthen with a failed retest of 52.78
- Resistance sits near 53.89 to 54.27, with 54.56 and 55.05 above that.
- Support holds between 53.01 and 52.78, with 52.64 and 52.28 below that.
Upside trades – Two options
- Positive retest of continuation level -53.54
- Positive retest of support level– 53.18
- Opening target ranges – 53.32, 53.48, 53.76, 54.05, 54.25, 54.4, 54.54, 53.68, 53.88, 54.05, 54.19, 54.54, 54.85, 55.04, 55.12, 55.48, 55.68, 55.88, 56.04
Downside trades- Two options
- Failed retest of resistance level -53.48
- Failed retest of support level– 53.01
- Opening target ranges – 53.27, 53.11, 52.8, 52.64, 52.4, 52.2, 52.06, 51.91, 51.72, 51.52, 51.22, 51.04, 50.82, 50.47, 50.3, and 50.16
If you’re interested in the live trading room, it is now primarily stock market futures content, though we do track heavily traded stocks and their likely daily trajectories as well – we begin at 9am with a morning report and likely chart movements along with trade setups for the day.
As long as the trader keeps himself aware of support and resistance levels, risk can be very adequately managed to play in either direction as bottom picking remains a behavior pattern that is developing with value buyers and speculative traders.
Twitter: @AnneMarieTrades
The author trades stock market futures every day and may have a position in mentioned securities at the time of publication. Any opinions expressed herein are solely those of the author, and do not in any way represent the views or opinions of any other person or entity.

: Showing Some Signs of Emerging Strength")

