Stocks are headed higher on Thursday morning as traders look to retest this week’s highs into the holiday weekend.
See my trading commentary and key price levels for S&P 500 futures, Nasdaq futures, and Crude Oil.
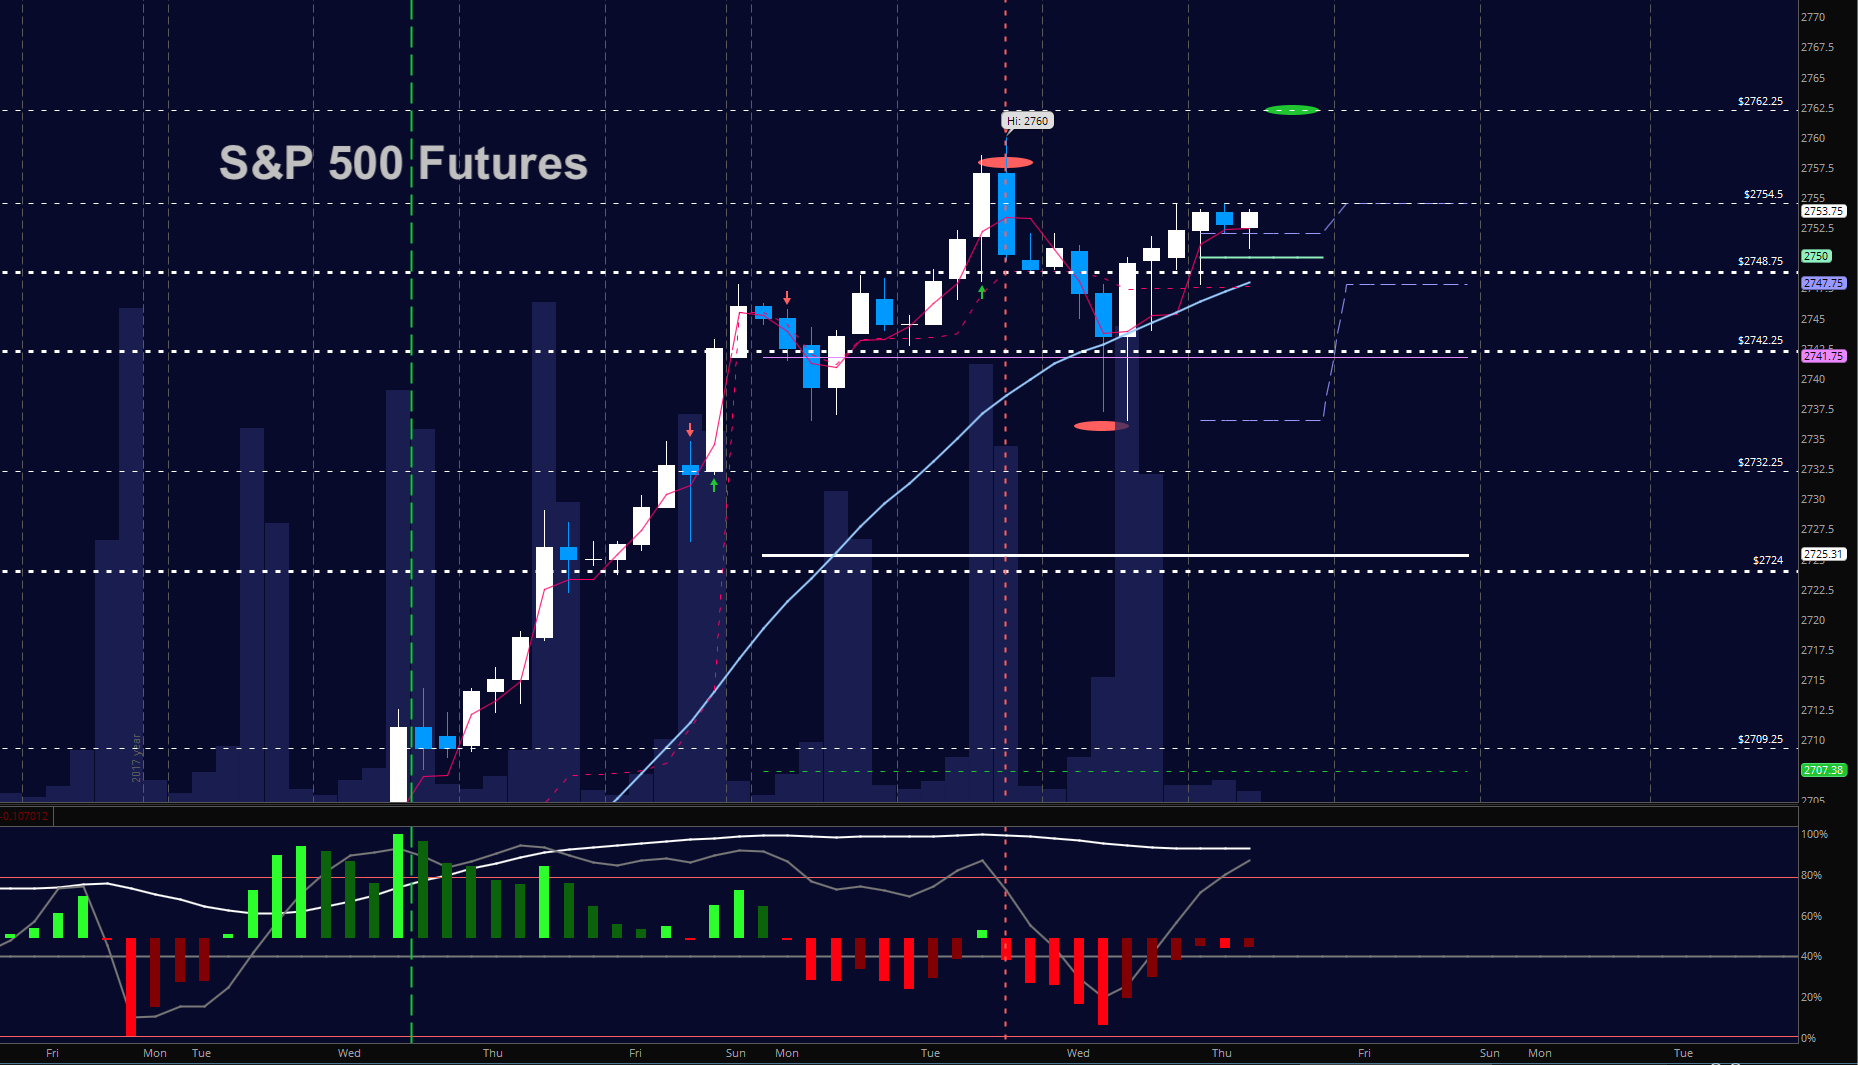
S&P 500 Futures
Support holds higher near 2742. Short trades still be swift but watch for lower highs if momentum begins to drift. Bullish formations hold well. The bullets below represent the likely shift of trading momentum at the positive or failed retests at the levels noted.
- Buying pressure intraday will likely strengthen with a positive retest of 2757.5
- Selling pressure intraday will likely strengthen with a failed retest of 2742.5
- Resistance sits near 2757.5 to 2762.25, with 2767.25 and 2771.75 above that.
- Support holds between 2747.5 and 2742.25, with 2736.25 and 2726.25 below that.
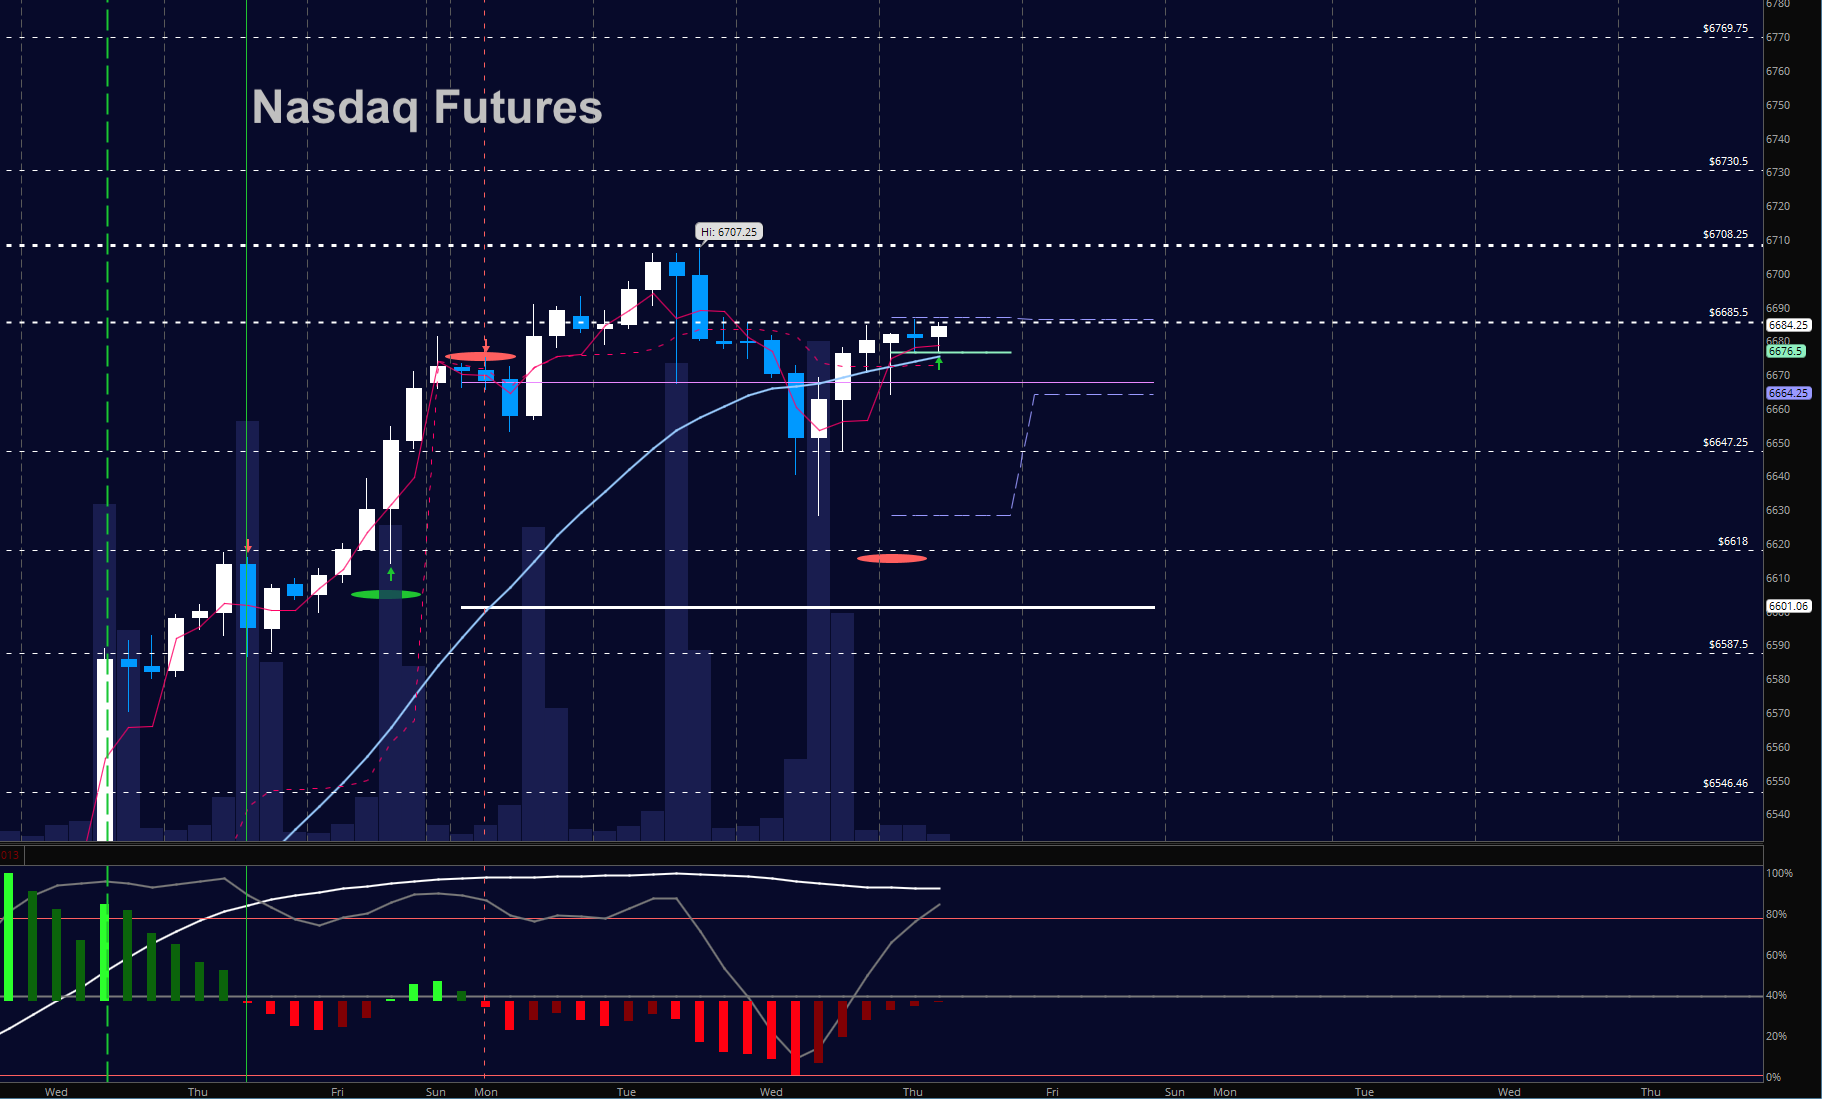
NASDAQ Futures
Strength of buyers delivers support bounces that hold nicely and traders force price into resistance and potentially new highs again. Momentum is bullish. Getting over 6705 will be key and holding the support level that is higher near 6686. The bullets below represent the likely shift of intraday trading momentum at the positive or failed tests at the levels noted.
- Buying pressure intraday will likely strengthen with a positive retest of 6696.75
- Selling pressure intraday will likely strengthen with a failed retest of 6672.75
- Resistance sits near 6690.5 to 6705.75 with 6713.5 and 6730.75 above that.
- Support holds near 6679.5 and 6657.75, with 6642.5 and 6628.5 below that.
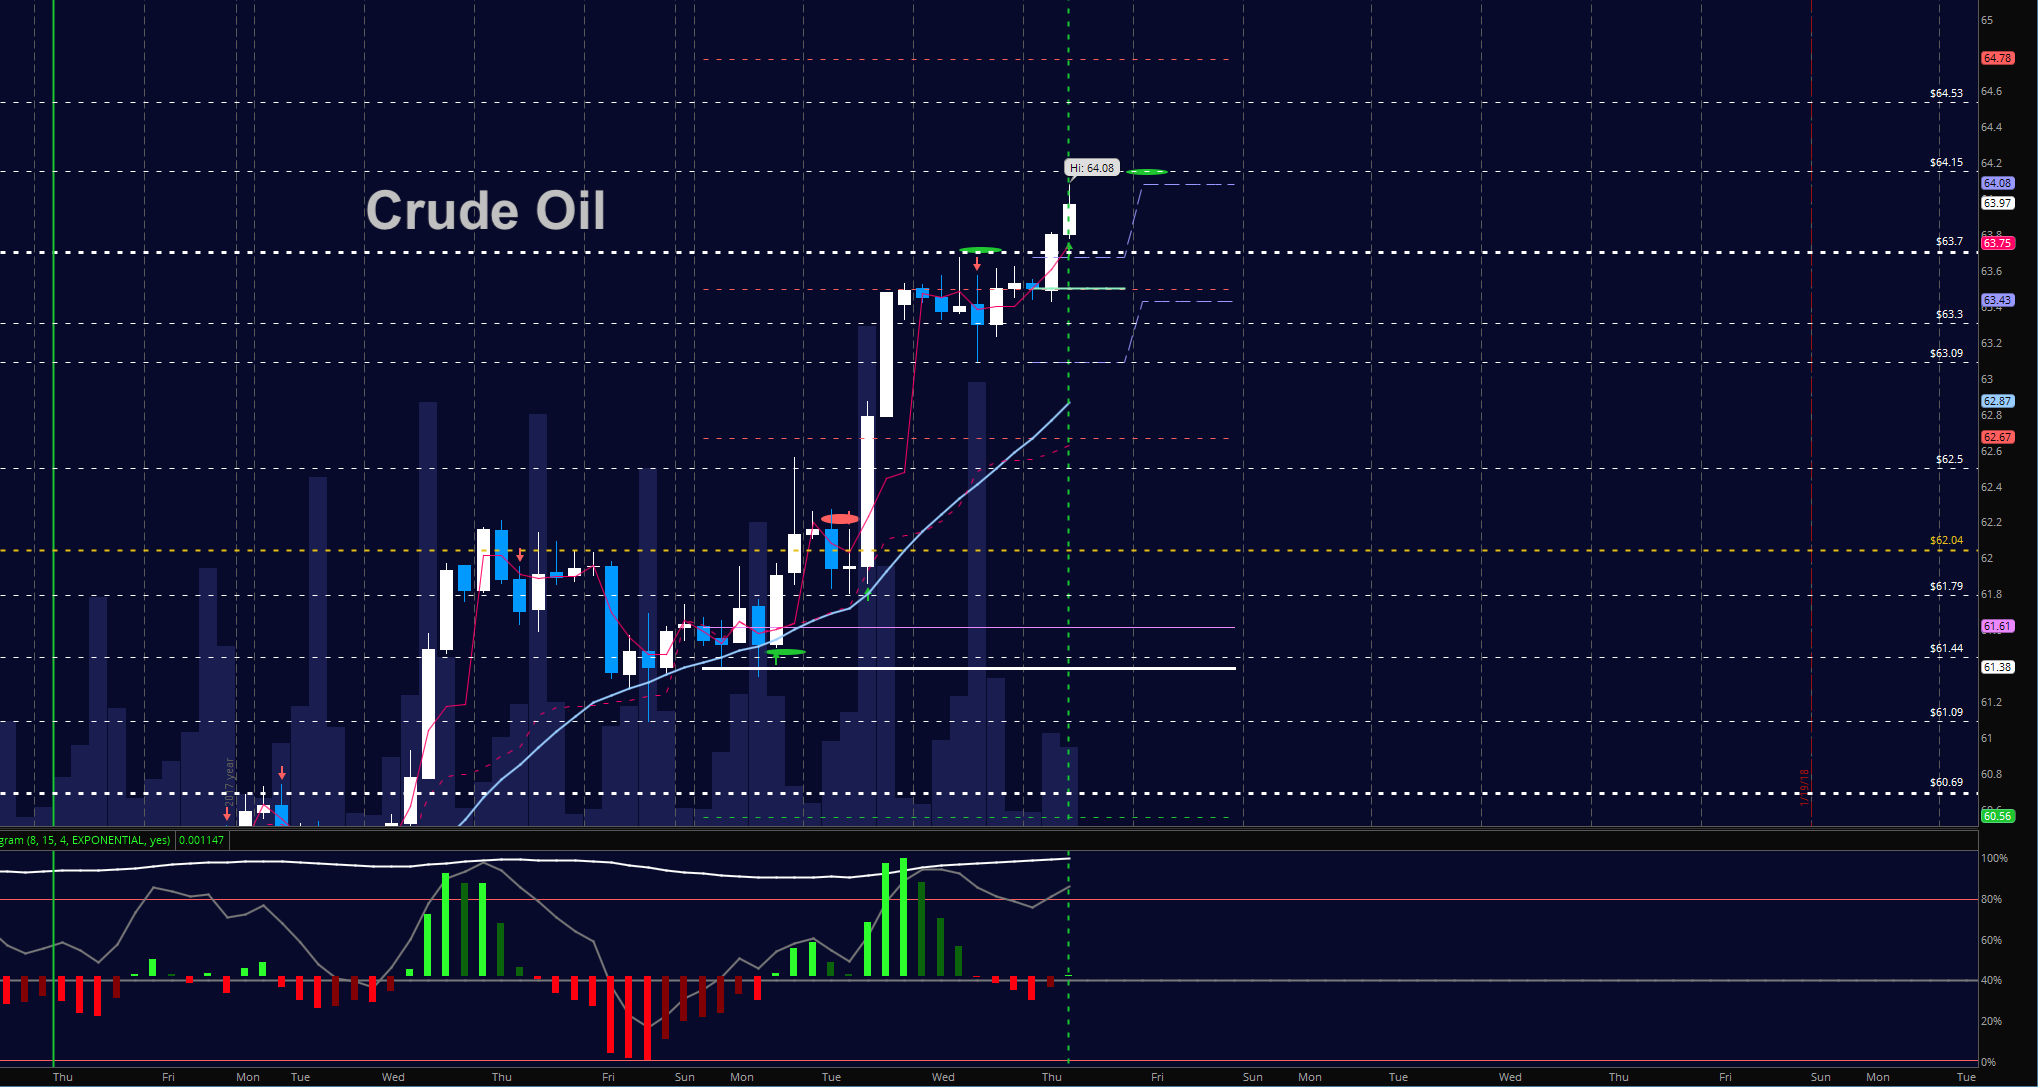
WTI Crude
Traders hold their bullish stance as drawdowns in inventories continue. The level near 65.4 with the Fibonacci level near 64.1 remain targets. The key level for buyers to hold now sits near 63.73. The bullets below represent the likely shift of trading momentum at the positive or failed tests at the levels noted.
- Buying pressure intraday will likely strengthen with a positive retest of 64.17
- Selling pressure intraday will strengthen with a failed retest of 63.67
- Resistance sits near 63.97 to 64.23, with 64.53 and 65.4 above that.
- Support holds near 63.73 to 63.44, with 63.1 and 62.3 below that.
If you’re interested in the live trading room, it is now primarily stock market futures content, though we do track heavily traded stocks and their likely daily trajectories as well – we begin at 9am with a morning report and likely chart movements along with trade setups for the day.
As long as the trader keeps himself aware of support and resistance levels, risk can be very adequately managed to play in either direction as bottom picking remains a behavior pattern that is developing with value buyers and speculative traders.
Twitter: @AnneMarieTrades
The author trades stock market futures every day and may have a position in mentioned securities at the time of publication. Any opinions expressed herein are solely those of the author, and do not in any way represent the views or opinions of any other person or entity.

 Testing Important Price Support")
: Cup (and Maybe Handle) Watch")

