Stock market futures are pushing slightly higher in early trade as buyers continue to show demand.
That said, we are at a juncture that requires discipline and focus from traders. See today’s trading commentary and price levels below.
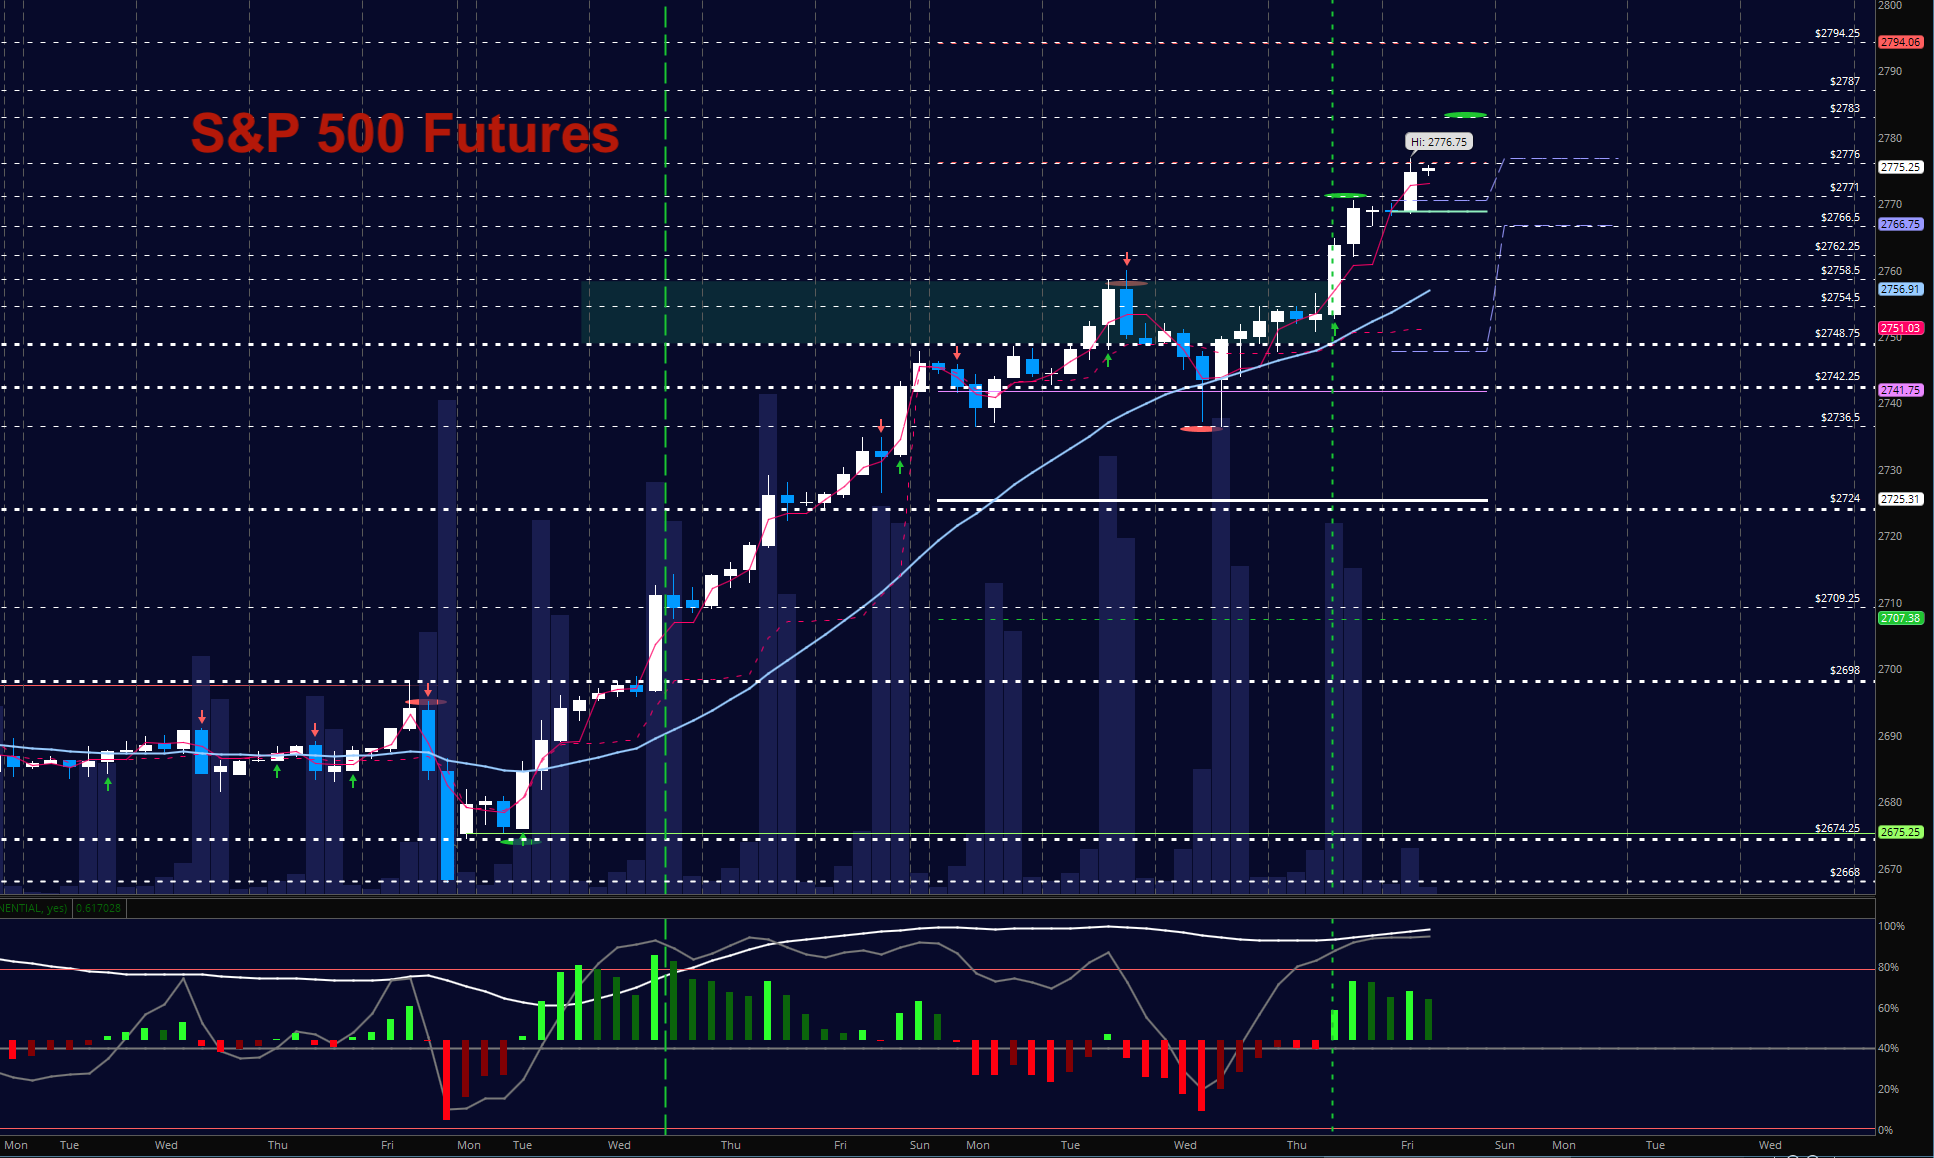
S&P 500 Futures
BUYERS ARE IN CLEAR CONTROL AS CHARTS PRESS HIGHER. Use caution buying breakouts still as the news of global strength hits our charts from European and Asian trading. Pullbacks will still find buyers but be patient rushing in. The bullets below represent the likely shift of trading momentum at the positive or failed retests at the levels noted.
- Buying pressure intraday will likely strengthen with a positive retest of 2776.75
- Selling pressure intraday will likely strengthen with a failed retest of 2761.5
- Resistance sits near 2770.5 to 2776.25, with 2783.25 and 2787.75 above that.
- Support holds between 2766.5 and 2761.5, with 2754.5 and 2736.75 below that.
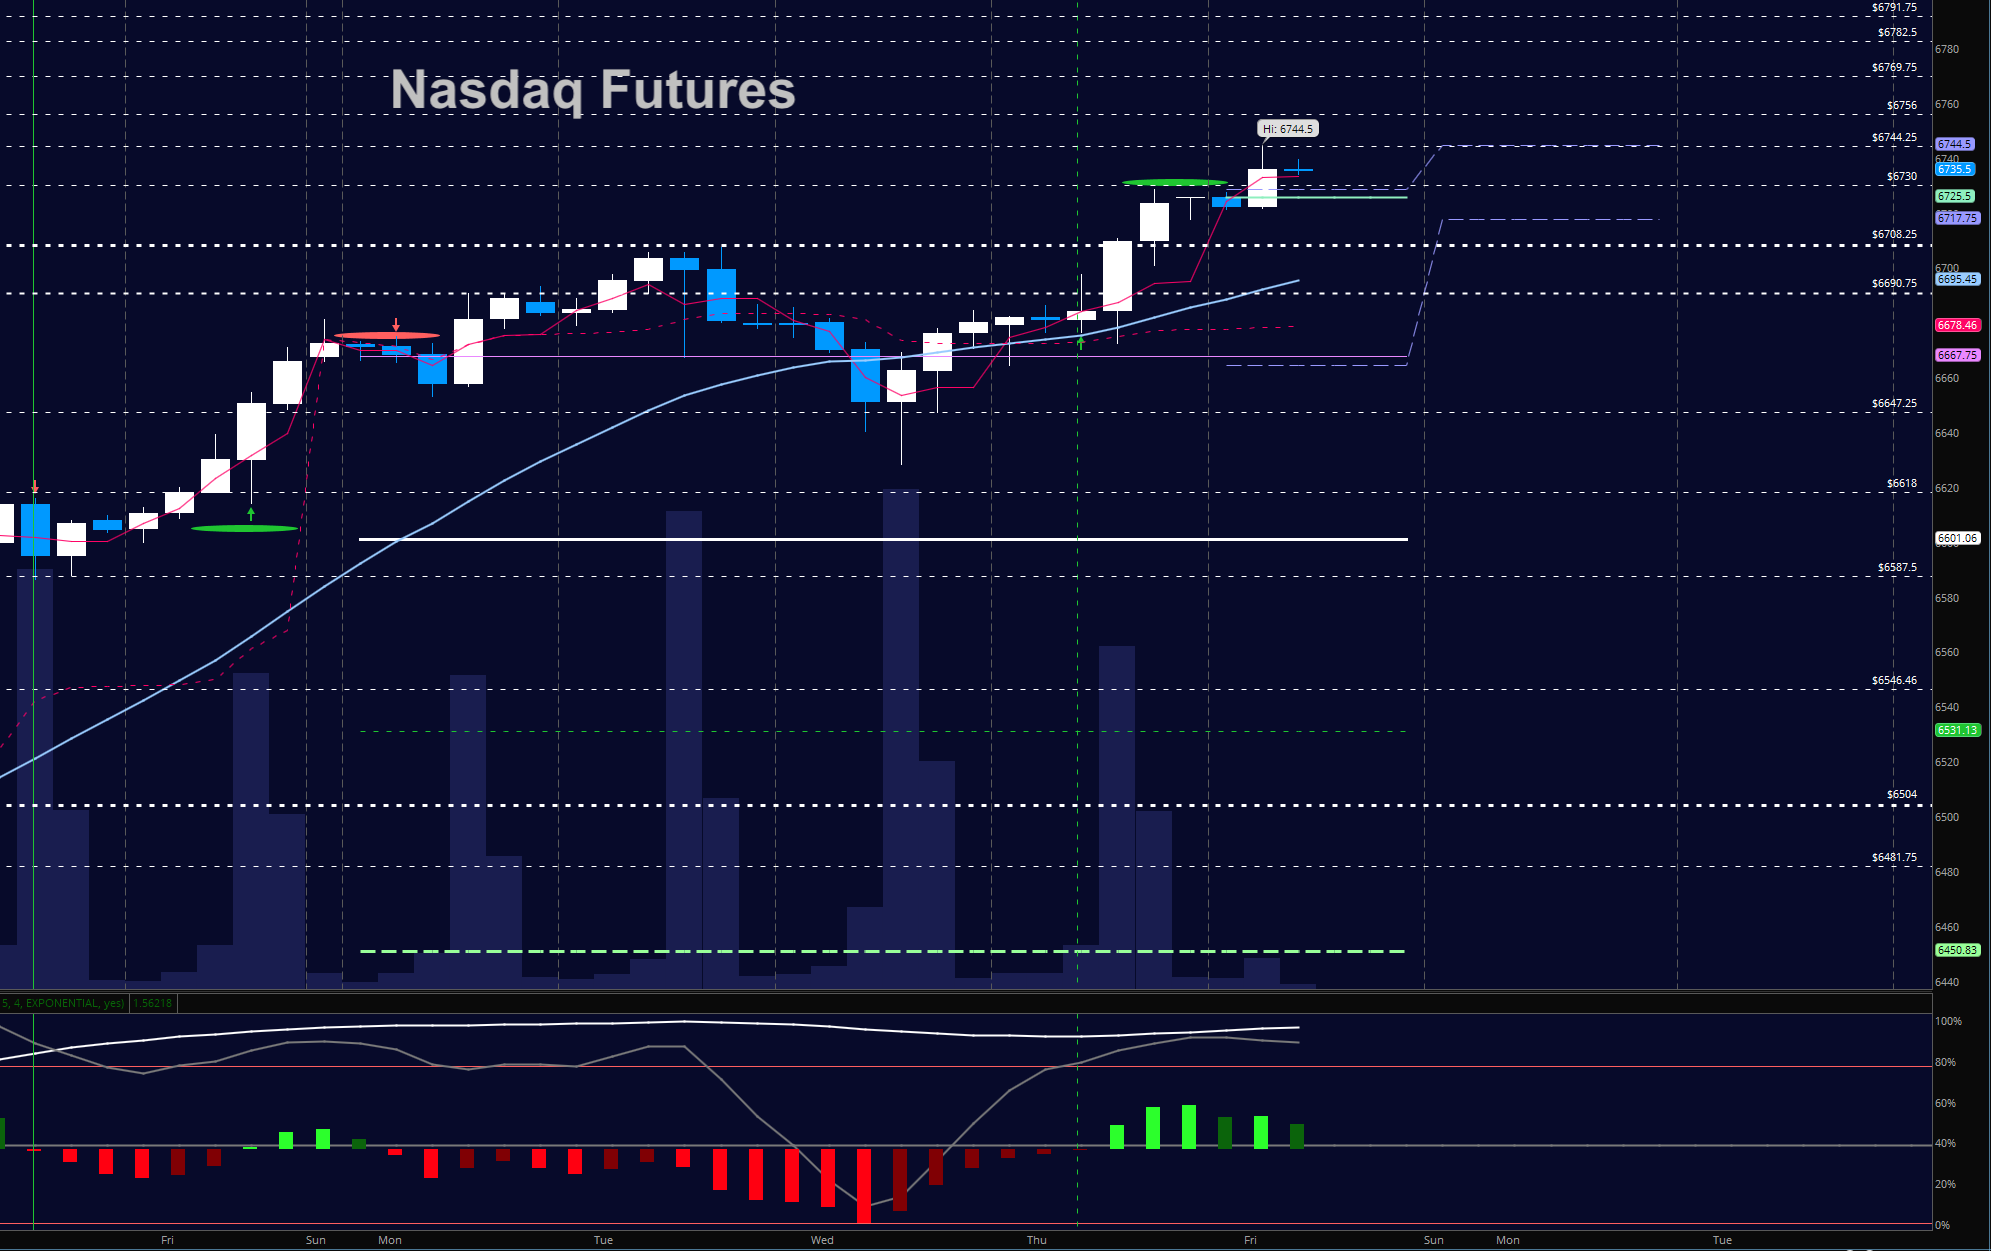
NASDAQ Futures
Strength of buyers delivers support bounces that hold nicely and traders force price into resistance and new highs again as global growth news spurs traders onward. Momentum is bullish but we are in a fade to support so be patient initiating long trades as we are quite extended and the NQ_F have been prone to deeper sell offs. Getting over 6730.5 will be key for buyers to advance. The bullets below represent the likely shift of intraday trading momentum at the positive or failed tests at the levels noted.
- Buying pressure intraday will likely strengthen with a positive retest of 6730.25
- Selling pressure intraday will likely strengthen with a failed retest of 6694.75
- Resistance sits near 6727.75 to 6744.75 with 6756 and 6782.5 above that.
- Support holds near 6708.5 and 6694.25, with 6682.25 and 6667.5 below that.
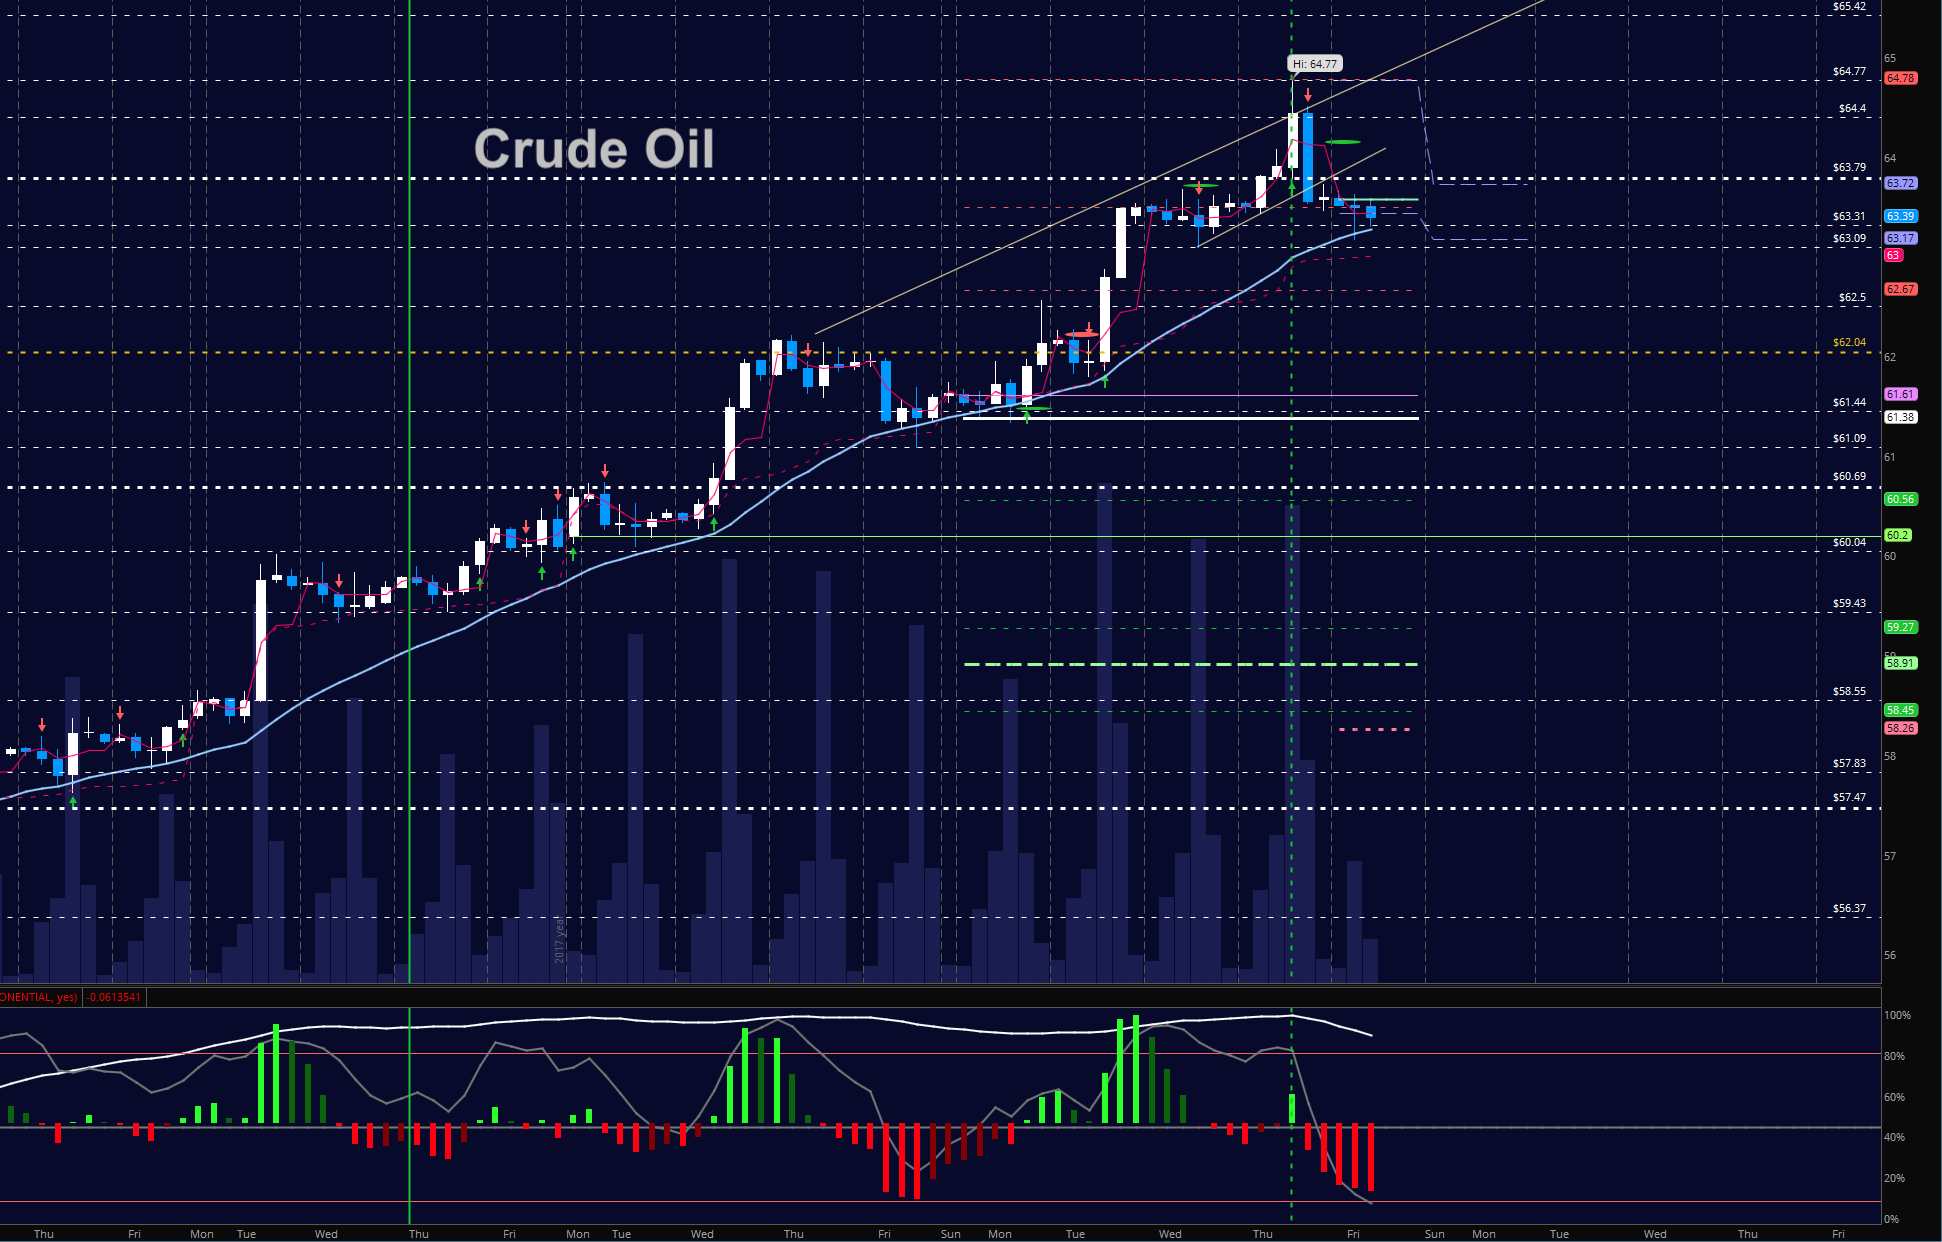
WTI Crude Oil
Traders sell the highs of yesterday and drift into a key area noted near 63. As we’ve moved up rapidly, there is a chance that deep support tests could be ahead but traders are bullish overall so stay frosty looking for support to hold during the day. The rig count is reported today. The bullets below represent the likely shift of trading momentum at the positive or failed tests at the levels noted.
- Buying pressure intraday will likely strengthen with a positive retest of 64.12
- Selling pressure intraday will strengthen with a failed retest of 63
- Resistance sits near 63.6 to 64.1, with 64.45 and 65.4 above that.
- Support holds near 63.01 to 62.67, with 62.23 and 61.87 below that.
If you’re interested in the live trading room, it is now primarily stock market futures content, though we do track heavily traded stocks and their likely daily trajectories as well – we begin at 9am with a morning report and likely chart movements along with trade setups for the day.
As long as the trader keeps himself aware of support and resistance levels, risk can be very adequately managed to play in either direction as bottom picking remains a behavior pattern that is developing with value buyers and speculative traders.
Twitter: @AnneMarieTrades
The author trades stock market futures every day and may have a position in mentioned securities at the time of publication. Any opinions expressed herein are solely those of the author, and do not in any way represent the views or opinions of any other person or entity.
: Creating Bullish Divergence?")


: Creating Bullish Divergence?")