Stock market futures are rallying again this morning. The relief rally continued as the price action has moved into higher resistance levels as expected. And one level we are currently watching is S&P 500 futures 1889.
Buyers have punched through initial resistance in overnight trading but are now holding steady at the newest contention level: S&P 500 futures 1889. The charts look a little tired, but pullbacks should still be bought as we ascend into higher resistance levels in a standard retracement event.
The Morning Report: S&P 500 futures 1889 In Focus
Look for higher lows to continue to develop the structure on the S&P 500 futures. If they do not, we have problems with upside targets being met. Longer time frame resistance levels for S&P 500 futures are sitting now at 1892.5, 1906.75, and 1915.
Intraday resistance sits near 1892.5. Intraday support sits at 1857 -(congestion sits at 1864 and 1868– watch these midlines – it will gives clues to moves ahead). Bounces should still be sold near resistance – but into higher lows as we continue into resistance.
Shorter time frame momentum indicators are positive and lifting, and higher than Thursday for stock market futures. Longer cycles are downward trending and lifting, but firmly in negative territory- this means larger upside resistance tests can be sold.
See today’s economic calendar with a rundown of releases.
THE RANGE OF TUESDAY’S MOTION
Crude Oil Futures (CL_F)
This chart is from January 20 but shows key resistance around 31.00 and extreme resistance around 32.70.
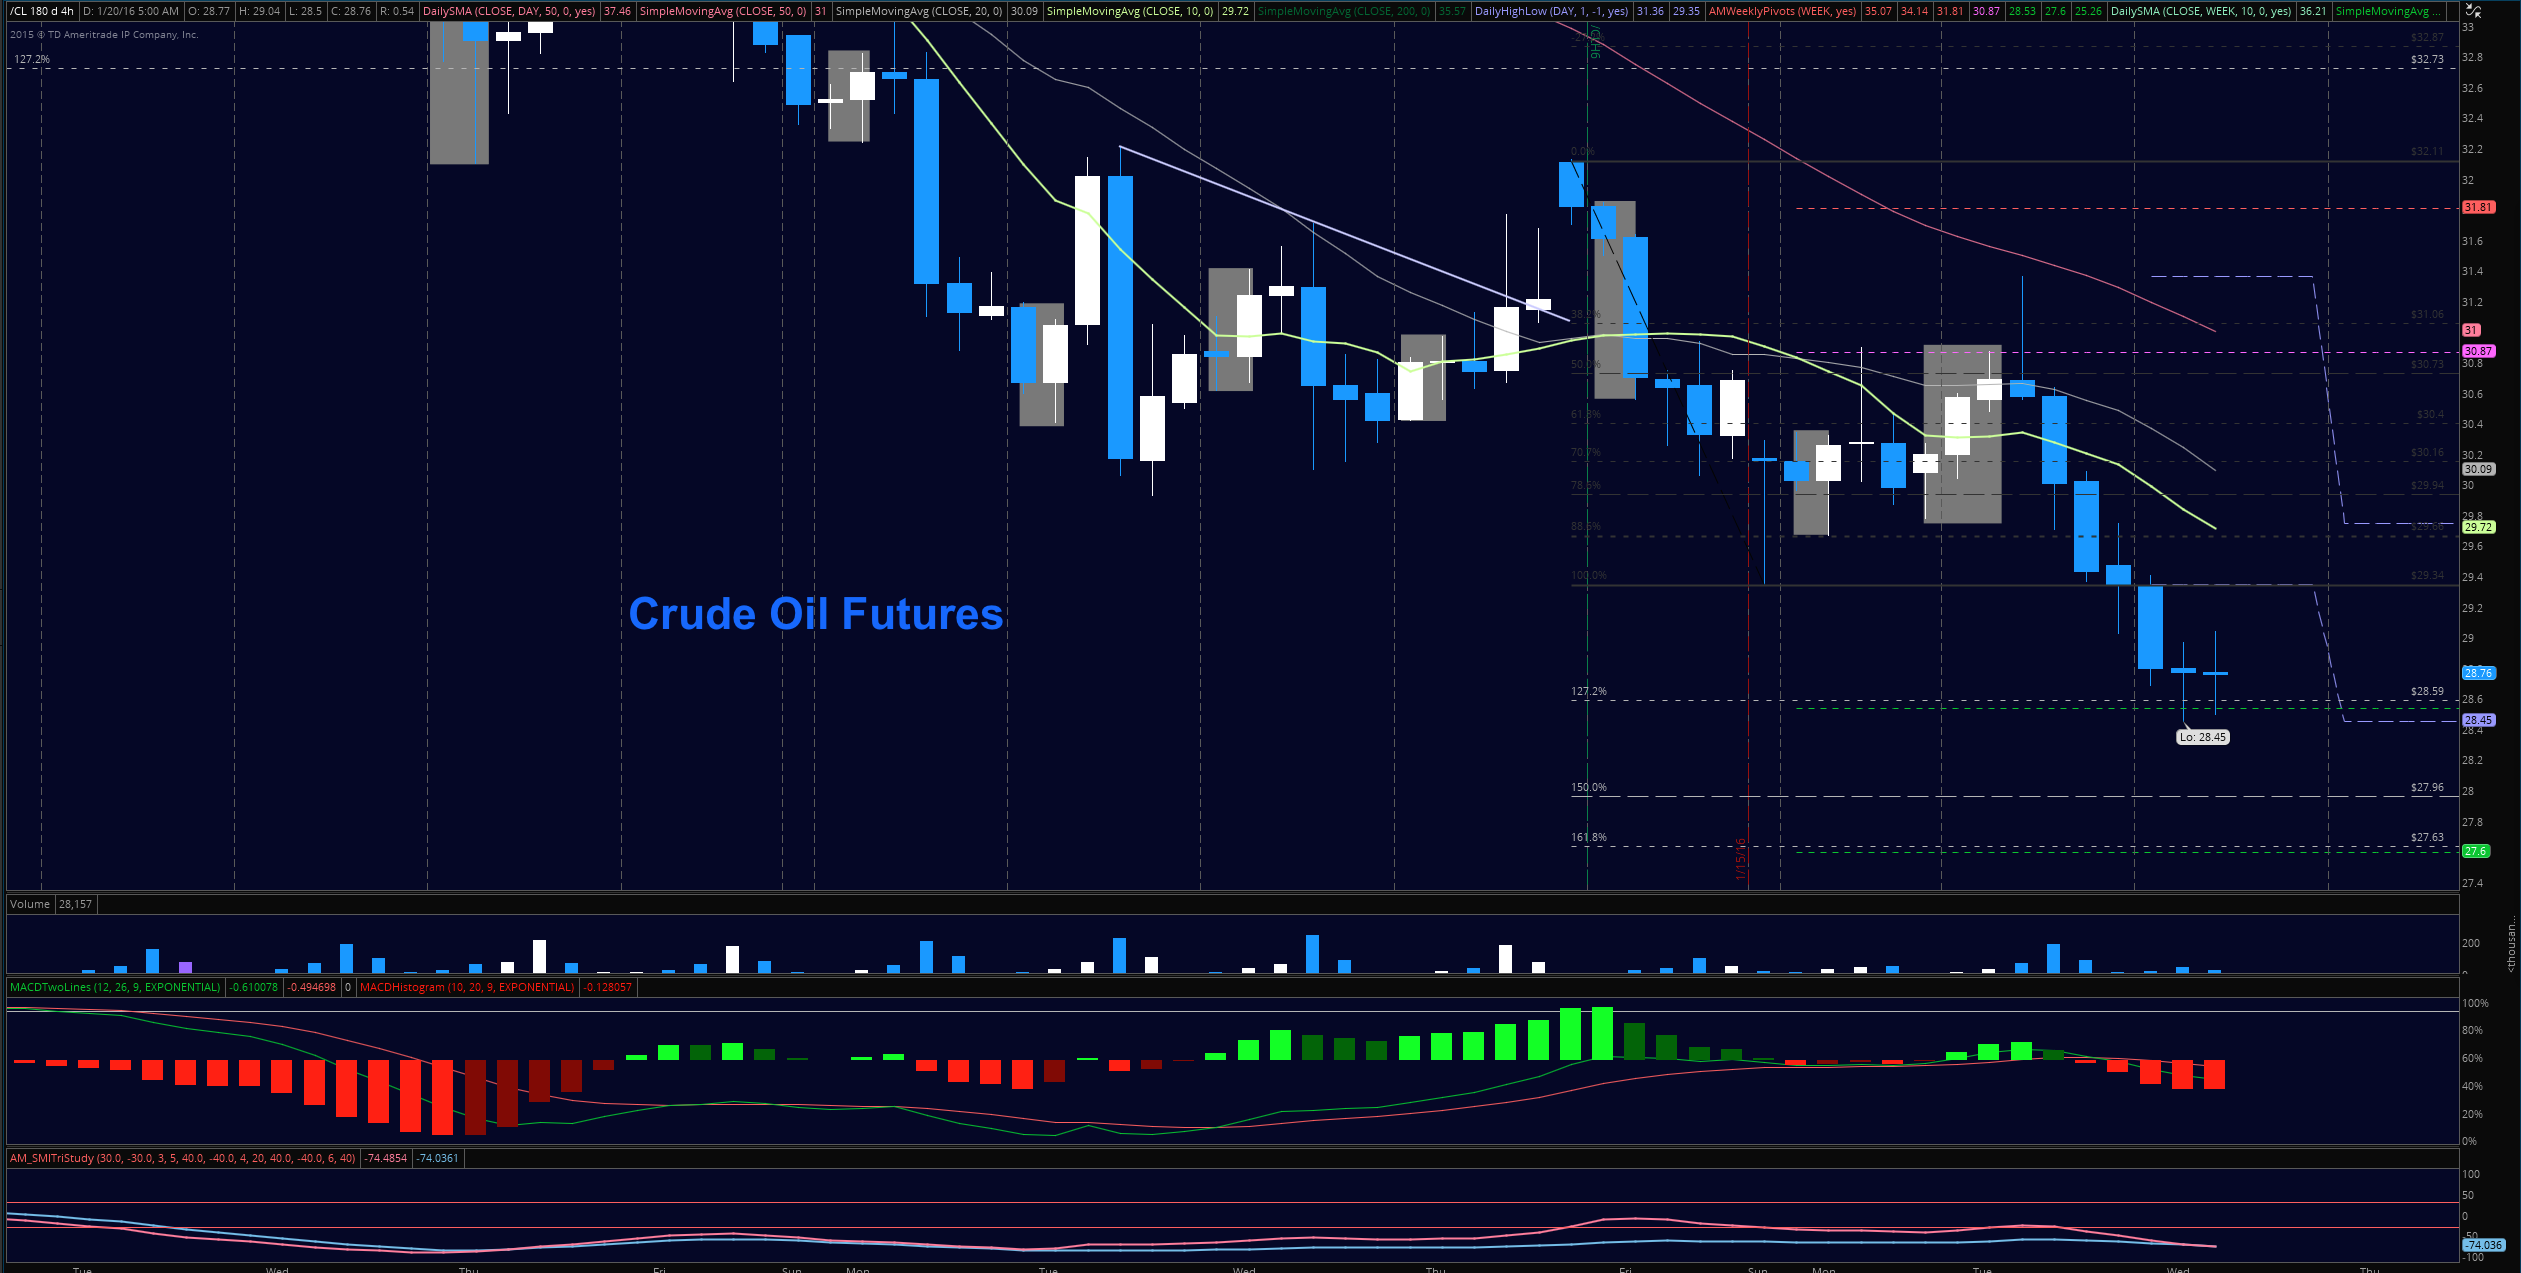
Cruce oil futures are also in the middle of a big relief bounce. Our targets from yesterday have just been met at this writing. We are looking at a bounce area likely to fail at 31.07 but should retrace into yet another higher low. Our relief bounce should last into 32.6 – 32.8 – but certainly not in a straight line =).
Trading ranges are between 30.25 and 31.35, with 30.68 being an important support level to hold on any retrace.
Moving averages on the crude oil charts are still clearly negative on longer time frames and are now approaching range expansion events that make bounces more appealing as trades into resistance. Momentum is securely negative but we are in the middle of a relief bounce with lots of pent up buying pressure. I remain quite bearish from a fundamental and technical space.
Intraday long trade setup suggests a long off 30.69 or 30.92 if the chart holds that region (counter trend big picture- but trending intraday) into 31.22, 31.35, 31.6, 31.8, 32.12, 32.35, 32.4 and 32.65– see the blog for levels above that region.
Intraday short trade setup suggests a short below a 30.6 failed retest or a rejection of the 31.8 area sends us to 31.4, 31.23, 31.1, 30.92, 30.69, 30.46, 30.29. Momentum on longer time frames remains sloping negative but somewhat divergent as we move north.
E-mini S&P 500 Futures (ES_F)
Below is a S&P 500 futures chart with price support and resistance trading levels for today. Click to enlarge.
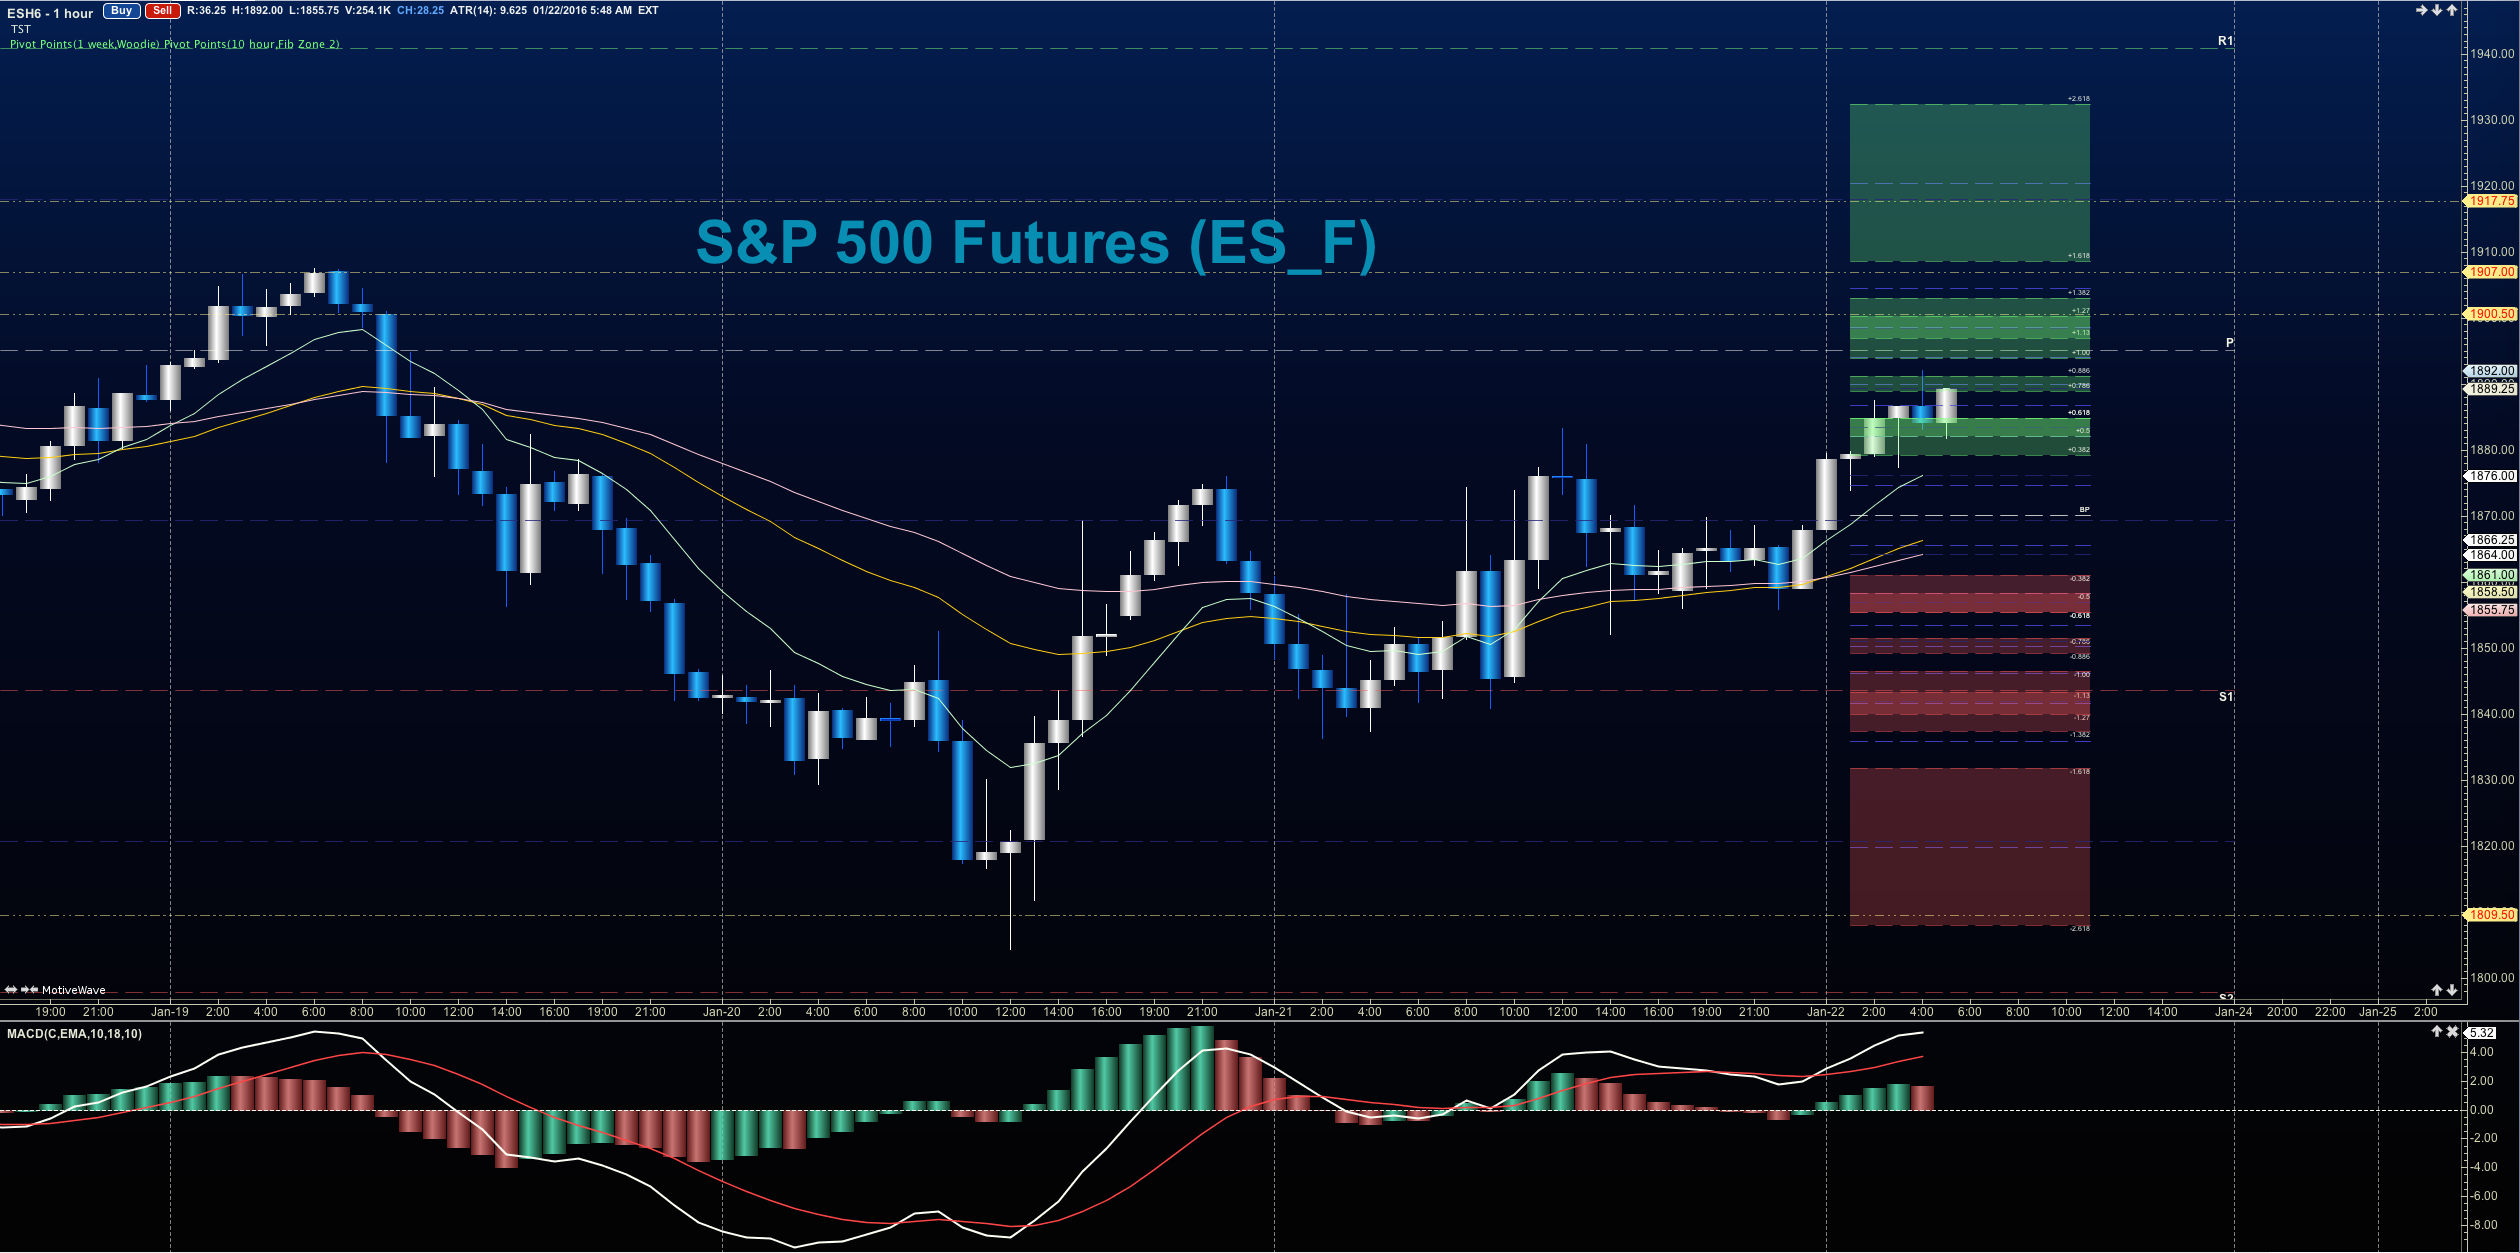
The S&P 500 futures chart is holding steady near resistance levels – currently testing 1890. Primary support sits at 1857.25, but a new band of buyers is attempting to hold 1883 as upper support.
Upside motion has the best setup on the breach of and positive retest of 1868.5 – or a bounce off 1857.5 (as long as momentum shows this as likely to hold- watch momentum or the drift lower is possible)- Targets from 1864.5 are 1868.25, 1872.5, 1883.25, 1889.25, and 1902.25 to 1907. The big resistance test is now at the region between S&P 500 futures 1889 to 1892 if the charts hold this bounce – that’s exactly where sellers are showing up in early trading today -so watch that area again for sellers to try to reverse the trend of the bounce. The chart could expand under positive strength into 1906, so be careful to watch the higher lows to keep you on the right side of the trade. Long trades are into higher resistance intraday at this writing.
Downside motion opens below the failed retest of 1880.5 or at the failure to hold 1891.5 bounce. A retracement by S&P 500 futures into lower levels from 1889.5 gives us the targets at 1883.5, 1881, 1878.5, 1871, 1868.5, 1861.25, 1857.75, 1845.5, 1842.5, and perhaps 1821.75 if the chart really loses its footing. We are attempting to base again at the 1838 level.
Long action intraday is trending (we are bouncing into resistance) currently unless we have a failure and negative retest of 1865.25 and negative momentum patterns.
If you’re interested in the live trading room, it is now primarily futures content, though we do track heavily traded stocks and their likely daily trajectories as well – we begin at 9am with a morning report and likely chart movements along with trade setups for the day.
As long as traders keep themselves aware of support and resistance levels, risk can be very adequately managed to play in either direction as bottom picking remains a behavior pattern that is developing with value buyers and speculative traders. Visit The Trading Vault to learn how to trade the way I do. Thanks for reading.
Twitter: @AnneMarieTrades
The author trades stock market futures every day and may have a position in mentioned securities at the time of publication. Any opinions expressed herein are solely those of the author, and do not in any way represent the views or opinions of any other person or entity.


: Showing Some Signs of Emerging Strength")
