Stock market futures seem to be moving towards a directional decision following the negative interest rate decision coming out of Japan. The initial reaction was a rally higher and now stock market futures have settled in and are awaiting a decisive break.
S&P 500 futures are still landlocked but at the top of the trading range now with support from moving averages sitting beneath – environments that suggest buyers will try to press out of congestion today.
The Morning Report: Futures Eye Critical Overhead Resistance Level
The charts are still muddy for the futures market – weak from a price perspective but building momentum. Pullbacks still seem to be buy zones with the key level to hold near 1877 on the S&P 500 futures. Longer time frame resistance levels are sitting now at 1902.25, 1904.75, and 1911, and 1915. Any large expansion that breaks higher will likely be retraced in this environment.
Intraday resistance sits near 1904 for S&P 500 futures. Intraday support sits at 1877 -(congestion sits between 1880 and 1886– watch this region – they will gives clues to moves ahead). Deeper pullbacks will likely continue to be bought, and expansions upward will be sold – stock market futures sit in jagged ranges, while still looking for higher lows to continue.
Shorter time frame momentum indicators are sitting in neutral to positive territory. Longer cycles are downward trending but lifting – this means larger upside resistance tests should be sold.
See today’s economic calendar with a rundown of releases.
THE RANGE OF TUESDAY’S MOTION
Crude Oil Futures (CL_F)
The monster rally in crude oil futures yesterday that retraced into a higher low is proving out all the higher momentum that we’ve been seeing. It’s also lifting stock market futures (a relief).
Momentum continues to show more bullish activity as we hold higher lows. Yesterday I said “A breach and hold above this area [32.8-32.9]will bring buyers en masses to the region.” And did they ever – but the move was too swift to hold so we are retracing into support near 33 and have lifted for there so far.
Trading ranges for crude oil futures are between 33 and 34, with 33.65 being an important support level to hold on any retrace as we trek north.
Moving averages for crude oil are still negative but losing steepness on longer time frames while holding bounces into higher lows. This will give buyers confidence in moving forward.
Intraday long trade setups suggest a long off 33.04 or 32.57 (with momentum showing positive, else that brings a lower high) into 33.2, 33.57, 33.95, 34.1, 34.45, 34.89, 35.11 and finally at 35.8 – charts are very likely to exhaust at regions near the high end of our trajectory.
Intraday short trade setups suggest a short below a 33 failed retest or a failed retest of 34.1 with negative divergence showing sends us to 33.54, 33.27, 33.05, 32.57, 32.25, 32.2, and 31.78. Momentum on longer time frames remains negative but flattening and still somewhat divergent as we move north.
E-mini S&P 500 Futures (ES_F)
Below is a S&P 500 futures chart with price support and resistance trading levels for today. Click to enlarge.
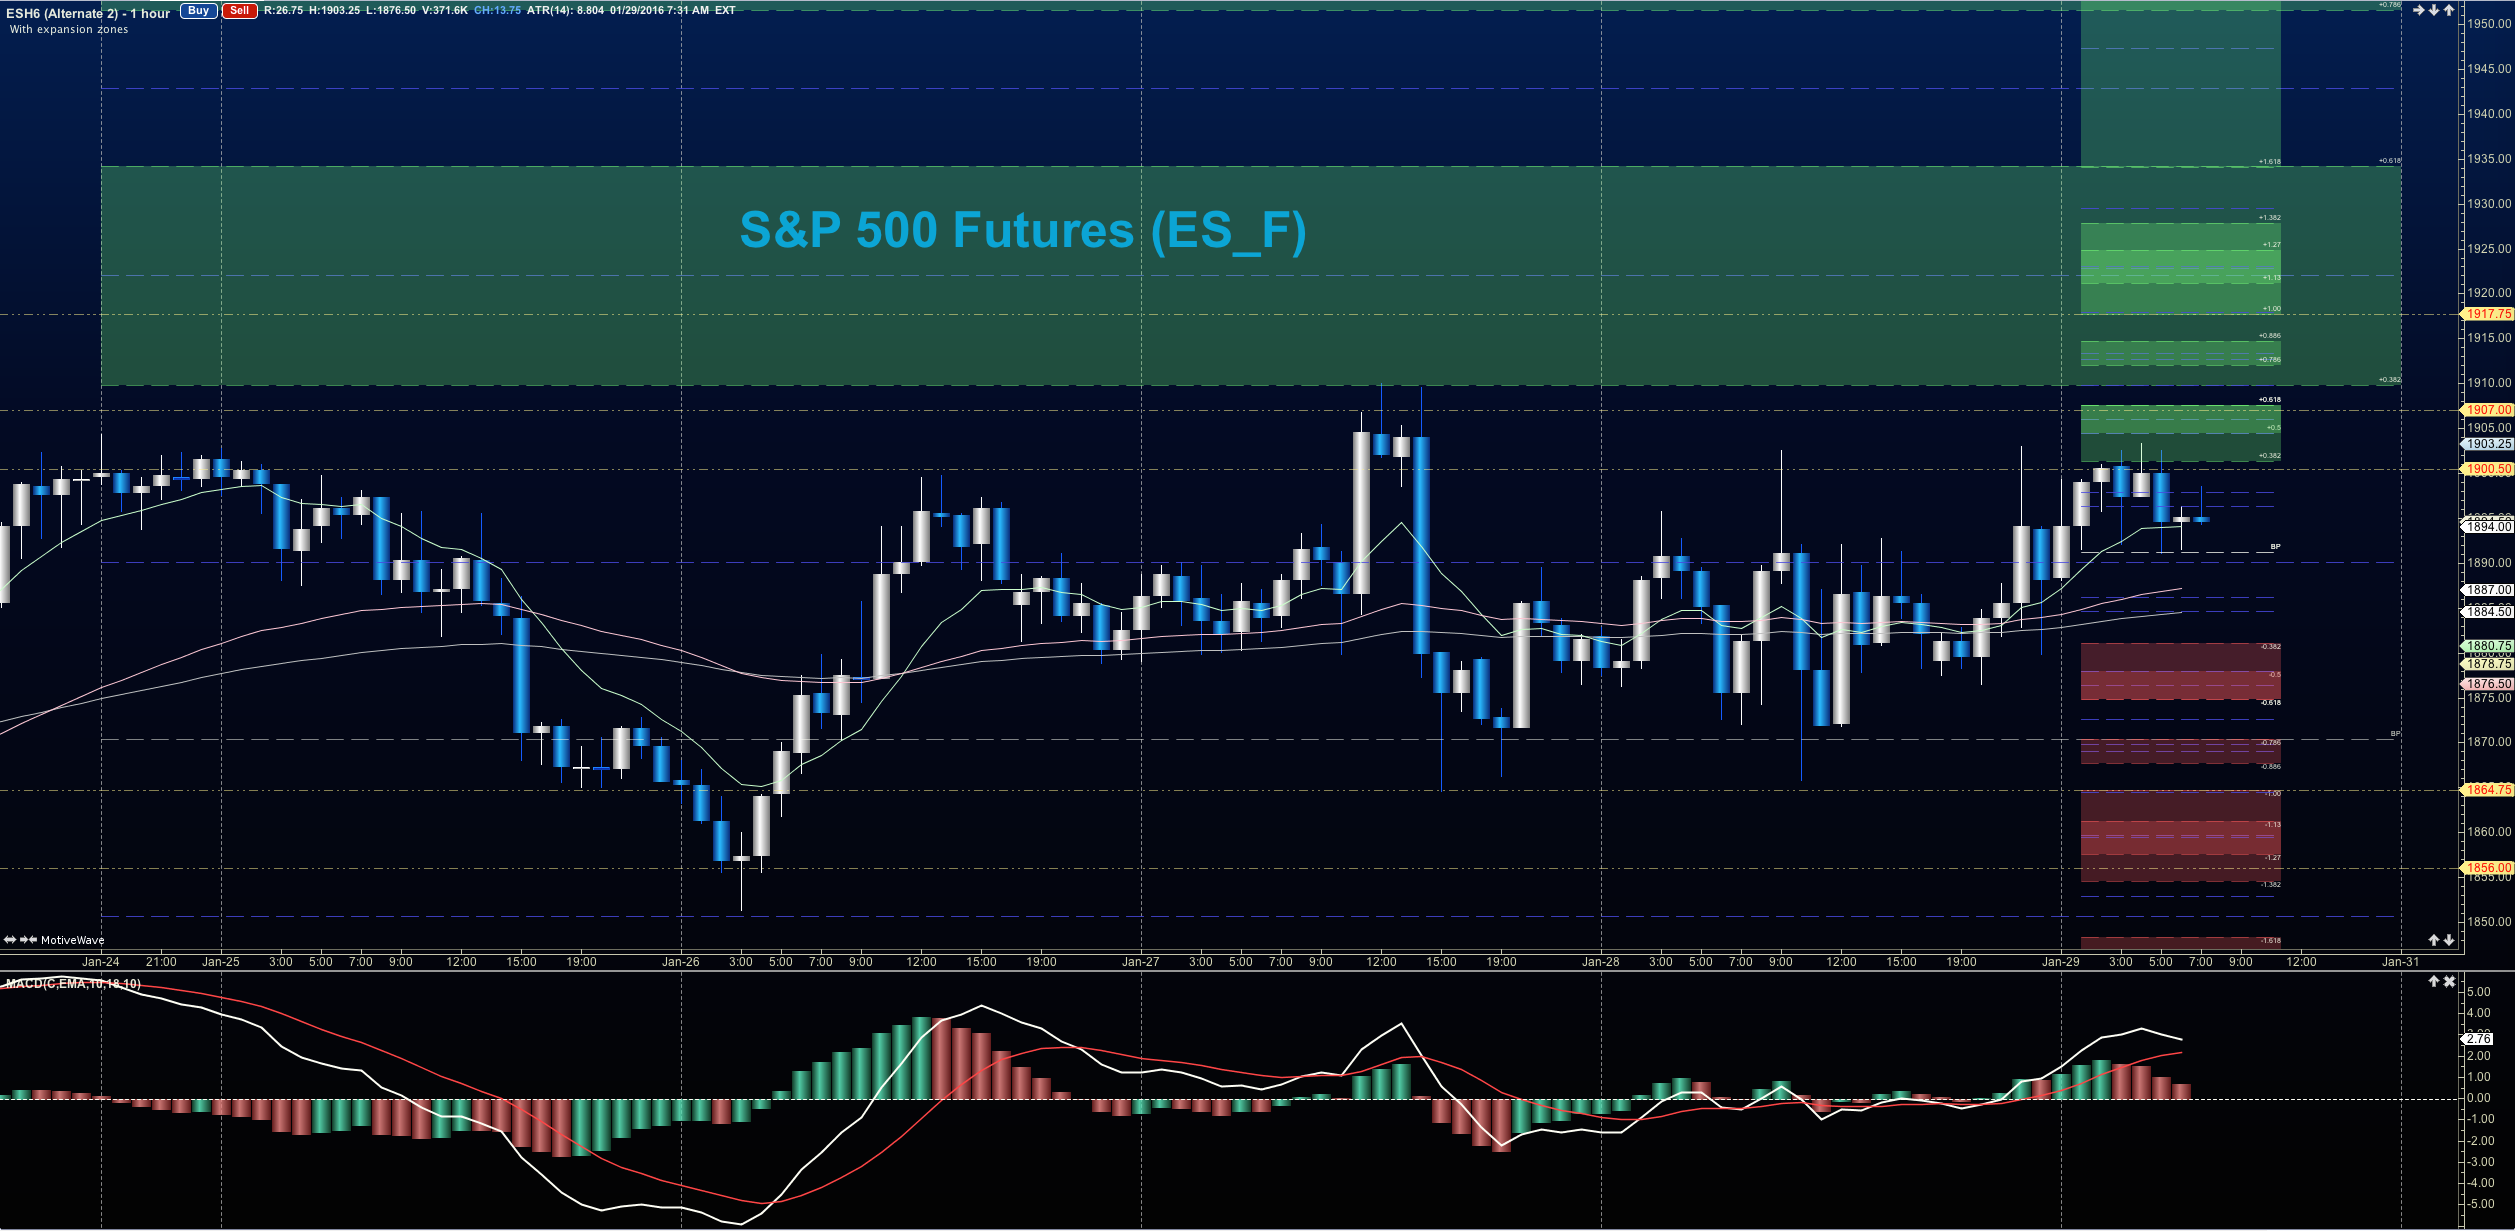
Stock market futures are holding steady near breakout levels but just below them. On the S&P 500 futures chart, a region of importance remains near 1887-1889. As long as we lie below these areas, we remain vulnerable to selling action. So far, we appear to have breached to the upside but I anticipate a reversal into these levels of importance before any moves forward.
Upside motion has the best setup on the breach of and positive retest of 1887.5 – or a bounce off 1877. We could also consider a breakout above 1899 but be ready to take profit as it expands into 1904 at the first pass. S&P 500 futures targets from 1877 are 1879.5, 1883, 1887.5, 1891.25, 1894.5, 1899, 1902.25, 1904.25, and 1907.75. Big resistance test sits at the region between 1903–1904.5. The chart could expand under positive strength into 1911.25 -1914.75 and higher if momentum lifts. Be careful- watch the higher lows to keep you on the right side of the trade.
Downside motion opens below the failed retest of 1884.5 or at the failure to hold 1902.25 bounce – but that pullback would likely be into higher support. Retracement into lower levels from 1884.5 gives us the targets at 1880.5, 1877.25, 1875.25, 1871.75, and perhaps 1868.5.
If you’re interested in the live trading room, it is now primarily stock market futures content, though we do track heavily traded stocks and their likely daily trajectories as well – we begin at 9am with a morning report and likely chart movements along with trade setups for the day.
As long as traders remain aware of support and resistance levels, risk can be very adequately managed to play in either direction as bottom picking remains a behavior pattern that is developing with value buyers and speculative traders. Visit The Trading Vault to learn how to trade the way I do. Thanks for reading.
Twitter: @AnneMarieTrades
The author trades stock market futures every day and may have a position in mentioned securities at the time of publication. Any opinions expressed herein are solely those of the author, and do not in any way represent the views or opinions of any other person or entity.


 Flirting With Critical Support… Again")


