We’ve been essentially landlocked for almost five days trading sideways on stock market futures. On the S&P 500 futures, the range has included support levels between 1860 and 1890, with resistance holding around 1905.
The Morning Report: S&P 500 Futures Still Struggling To Recapture Key Levels
The charts are muddy – and still feel weak from a price perspective but momentum is building for a stock market futures rally. The charts are vulnerable to sellers below 1887, and we lost the daily 10sma (and need to recapture that); momentum suggests that sharp pullbacks on remain buy zones.
Longer time frame resistance levels for S&P 500 futures are sitting now at 1899, 1904.75, and 1911, and 1915.
Intraday resistance sits near 1896.5, while intraday support sits at 1864 -(congestion has widened and sits between 1875 and 1886– watch this region – they will gives clues to moves ahead). Deeper pullbacks will continue to be bought, and expansions upward will be sold – we sit in jagged ranges, while still looking for higher lows to continue as the stock market futures rally develops.
Buyers should be concerned about the lower highs developing (though we did break that trend yesterday before reversing lower). Today, it would be constructive if we could break yesterday’s highs.
Shorter time frame momentum indicators are sitting in neutral to negative territory. Longer cycles are downward trending but lifting –still firmly in negative territory- this means larger upside resistance tests should be sold within the stock market futures rally today.
See today’s economic calendar with a rundown of releases.
THE RANGE OF TUESDAY’S MOTION
Crude Oil Futures (CL_F)
Crude Oil futures prices have been in a battleground near 32.3 this morning. Momentum continues to show more bullish activity but again, this should only be into resistance – crude oil futures are still warring near the 32.8-32.9 level. A breach and hold above this area will bring buyers en masses to the region.
Current trading ranges for crude oil futures are between 31.7 and 32.8, with 32.25 being an important support level to hold on any retrace as we trek north.
Moving averages in oil are still clearly negative on longer time frames but holding bounces from that last large drift downward. This will give buyers confidence in moving forward. The region of contention remains 32.8-32.9.
Intraday long trade setup suggests a long off 32.9 or 31.7 (with momentum showing positive, else that brings a lower high) into 31.85, 32.12, 32.25, 32.67, 32.8, 33.2 and 34 but charts get very muddy in those regions above– see the blog for levels above that region.
Intraday short trade setup suggests a short below a 31.7 failed retest or a failed retest of 32.8 with negative divergence showing sends us to 32.55, 32.25, 31.7, 31.4, 31.22, 31.04, and 30.65. Momentum on longer time frames remains sloping negative but somewhat divergent as we move north.
E-mini S&P 500 Futures (ES_F)
Below is a S&P 500 futures chart with price support and resistance trading levels for today. Click to enlarge.
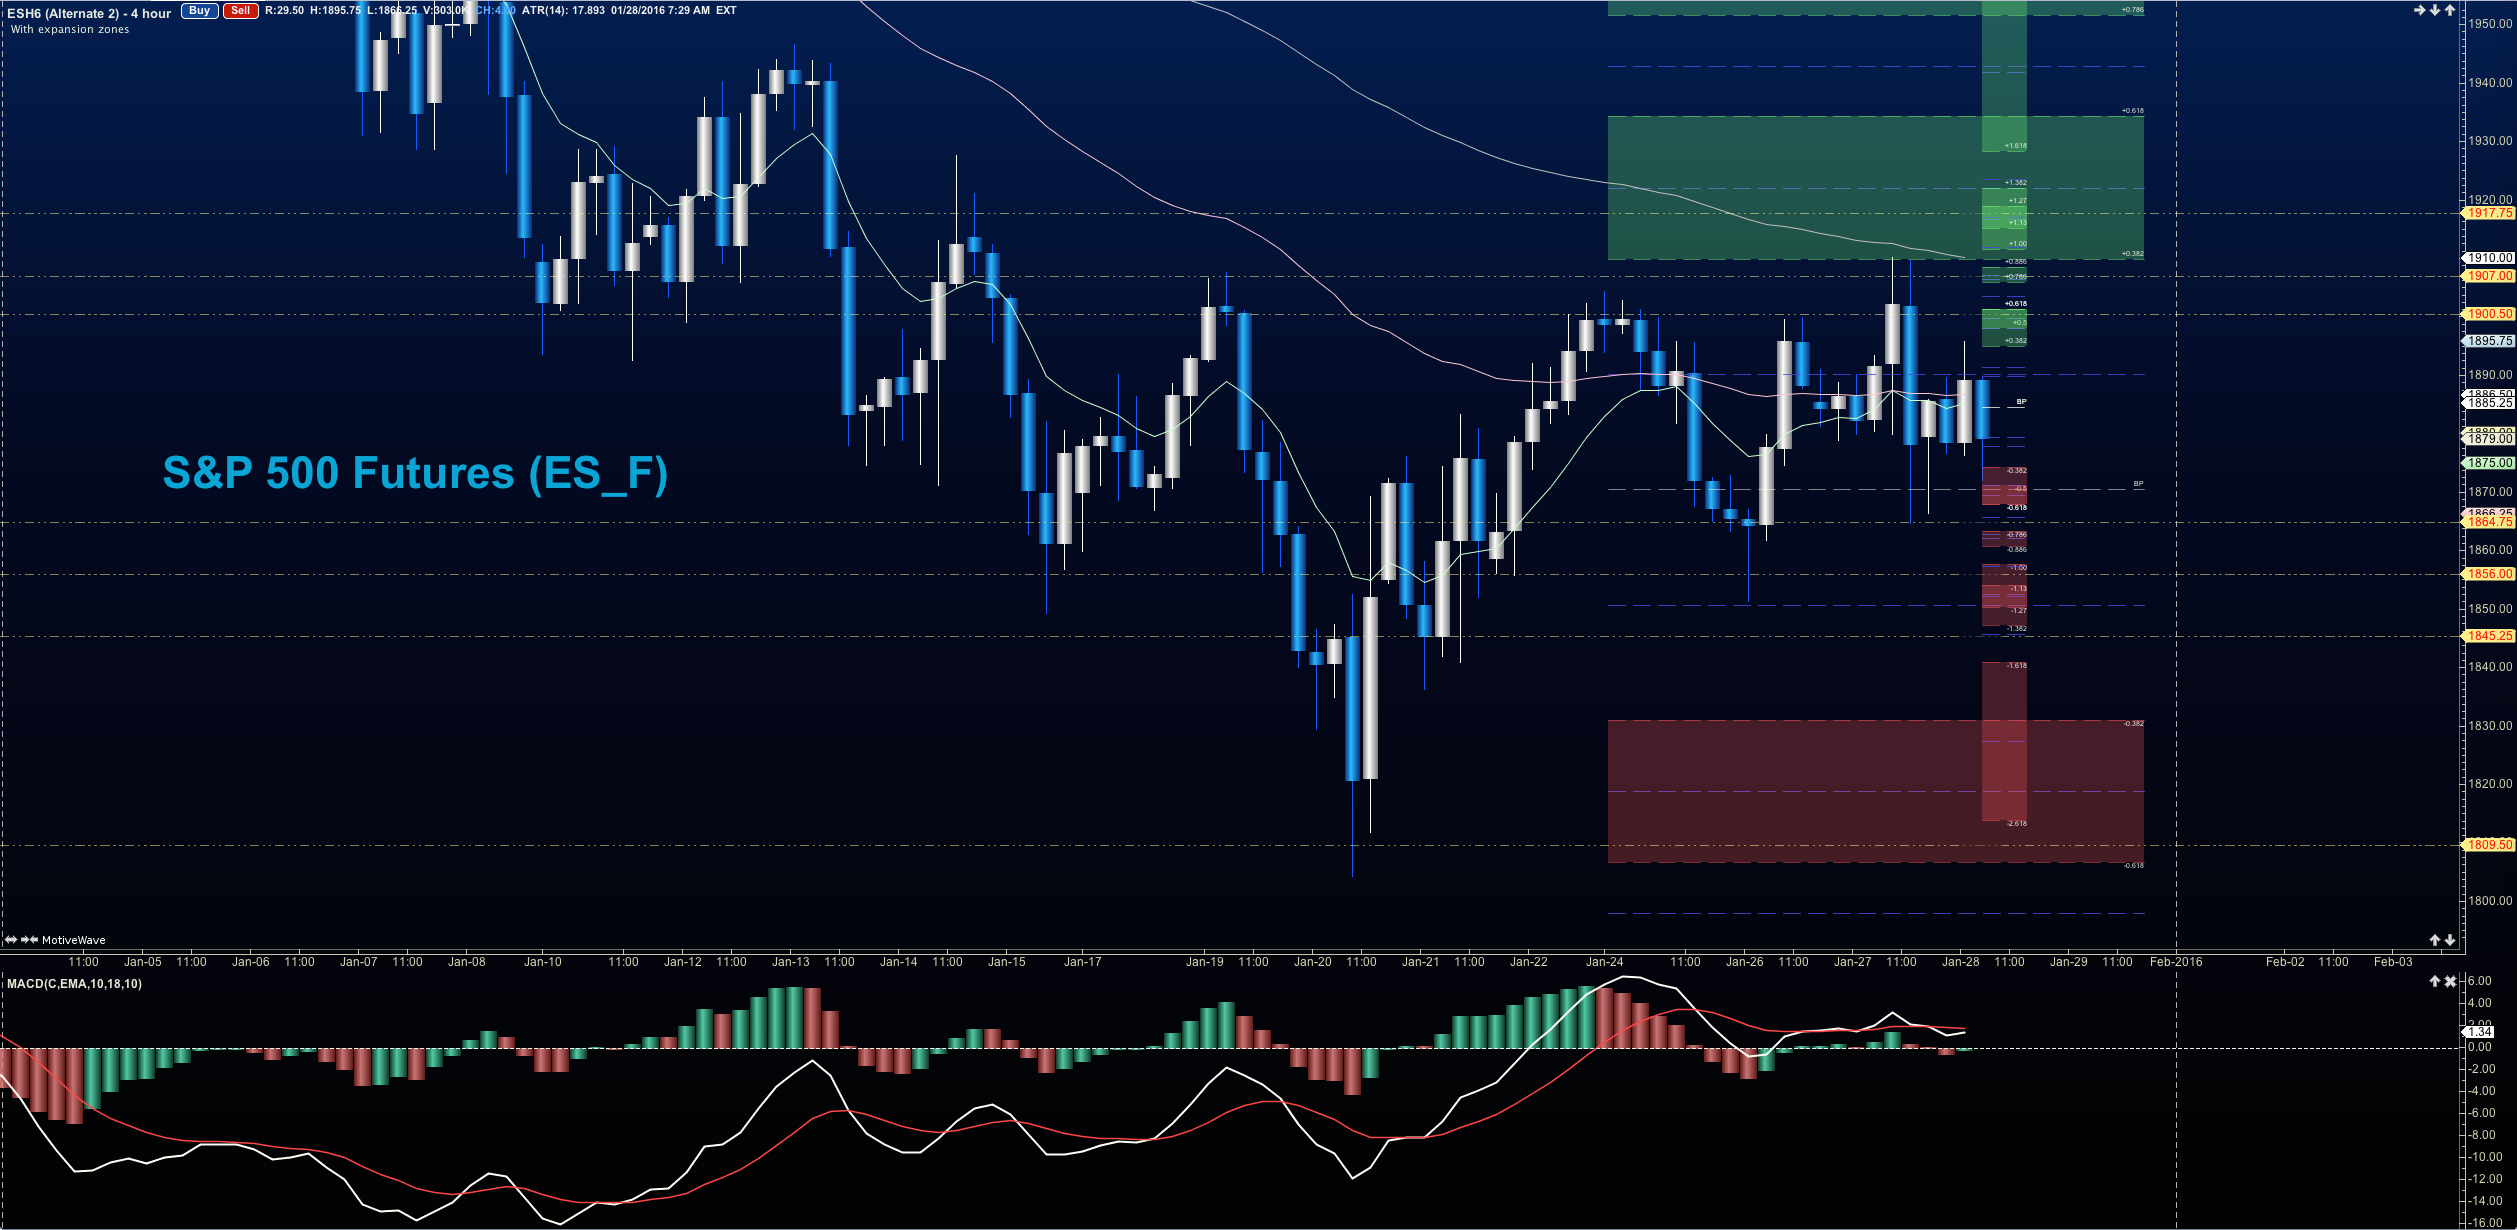
The S&P 500 futures chart is holding steady near mid range support levels – it tested 1878 before moving higher. A region of importance is near 1887-1889, and as long as we lie below these areas, we remain vulnerable to more selling action. We show extreme congestion in the areas between 1879 and 1884. Trading in those ranges will be tricky. But a break higher would be positive for a broader stock market futures rally.
Upside motion has the best setup on the breach of and positive retest of 1887.5 – or a bounce off 1875, but if we come back there, watch for a potential lower high setting in intraday. Targets from 1875 are 1878.5, 1883, 1886.5, 1889.25, 1892, 1894.5, 1899, and 1902.25. Big resistance test sits at the region between 1894–1896.5. The S&P 500 futures chart could expand under positive strength into 1904.25 and higher if momentum lifts. Be careful- watch the higher lows to keep you on the right side of the trade.
Downside motion opens below the failed retest of 1871.5 or at the failure to hold 1892 bounce – but that pullback would likely be into higher support. Retracement into lower levels from 1871.5 gives us the targets at 1868.5, 1865, 1861.25, 1857.75, and perhaps 1847.75.
If you’re interested in the live trading room, it is now primarily futures content, though we do track heavily traded stocks and their likely daily trajectories as well – we begin at 9am with a morning report and likely chart movements along with trade setups for the day.
As long as traders remain aware of support and resistance levels, risk can be very adequately managed to play in either direction as bottom picking remains a behavior pattern that is developing with value buyers and speculative traders.
Twitter: @AnneMarieTrades
The author trades stock market futures every day and may have a position in mentioned securities at the time of publication. Any opinions expressed herein are solely those of the author, and do not in any way represent the views or opinions of any other person or entity.


