Stock market futures outlook for March 10: Congestion levels are tested as buyers push price into resistance levels once more. The 1991.5 battleground is firming up as new support. Though penetrated, it quickly recovers. The sideways motion of the past three days is bringing extreme momentum levels down into more normal readings – not good news for sellers hoping to participate in ‘overbought’ selling conditions.
Range expansion into higher levels for stock market futures are still not likely to hold once more, and will continue to give us countertrend shorts into support. Buyers will force price to hold at support regions.
Momentum on the four hour chart is negative but drifting back into neutral territory. Daily charts continue to show momentum as trending positive, and in positive territory. A clear signal to me that the power of momentum still sits with buyers as we sit near the top of the trading range.
Shorter time frame momentum indicators are sloping up, but jammed against resistance. 1991.25 – 1986.5 is the support region to watch for sellers to test and for buyers to hold if this chart fails to move forward- so far, it is holding.
See today’s economic calendar with a rundown of releases.
THE RANGE OF THURSDAY’S MOTION
Crude Oil Futures (CL_F)
March 10 outlook for crude oil futures – Another EIA report with a build did not dissuade buyers from adding at the pullback regions as support holds steady in the space of damp momentum.
Today, the trading ranges for crude oil futures are between 37.3 and 38.48 – the top line resistance has held for three days. The longer it holds there, the bigger the potential for breaks in either direction. The best trade has been long off support, and short off resistance, but edges could fail dramatically in this formation when it does eventually break. So be careful at those edges today.
Moving averages in oil show rising positive momentum on longer time frames, but strong resistance looms ahead near 38.4- 38.6. Intraday support is steady at 37.3, but a failed retest there could significantly change the structure of this chart.
Intraday long trading setups for crude oil suggest a long off 38.06 positive retest, or 37.35 positive retest into 37.75, 37.94, 38.2 and if buyers hold on, we’ll see 38.42, 38.51, and 38.7 to potentially 38.94.
Intraday short trading setups suggest a short below a 37.8 failed retest with negative divergence, or the failed retest of 38.35 sends us back through targets at 37.35, 37.12, 36.8, 36.59, 36.2, 36.08, and back into familiar regions seen near 35.63, if sellers hang on.
Have a look at the Fibonacci levels marked in the blog for more targets.
E-mini S&P 500 Futures (ES_F)
Below is a S&P 500 futures chart with price support and resistance trading levels for today. Click to enlarge.
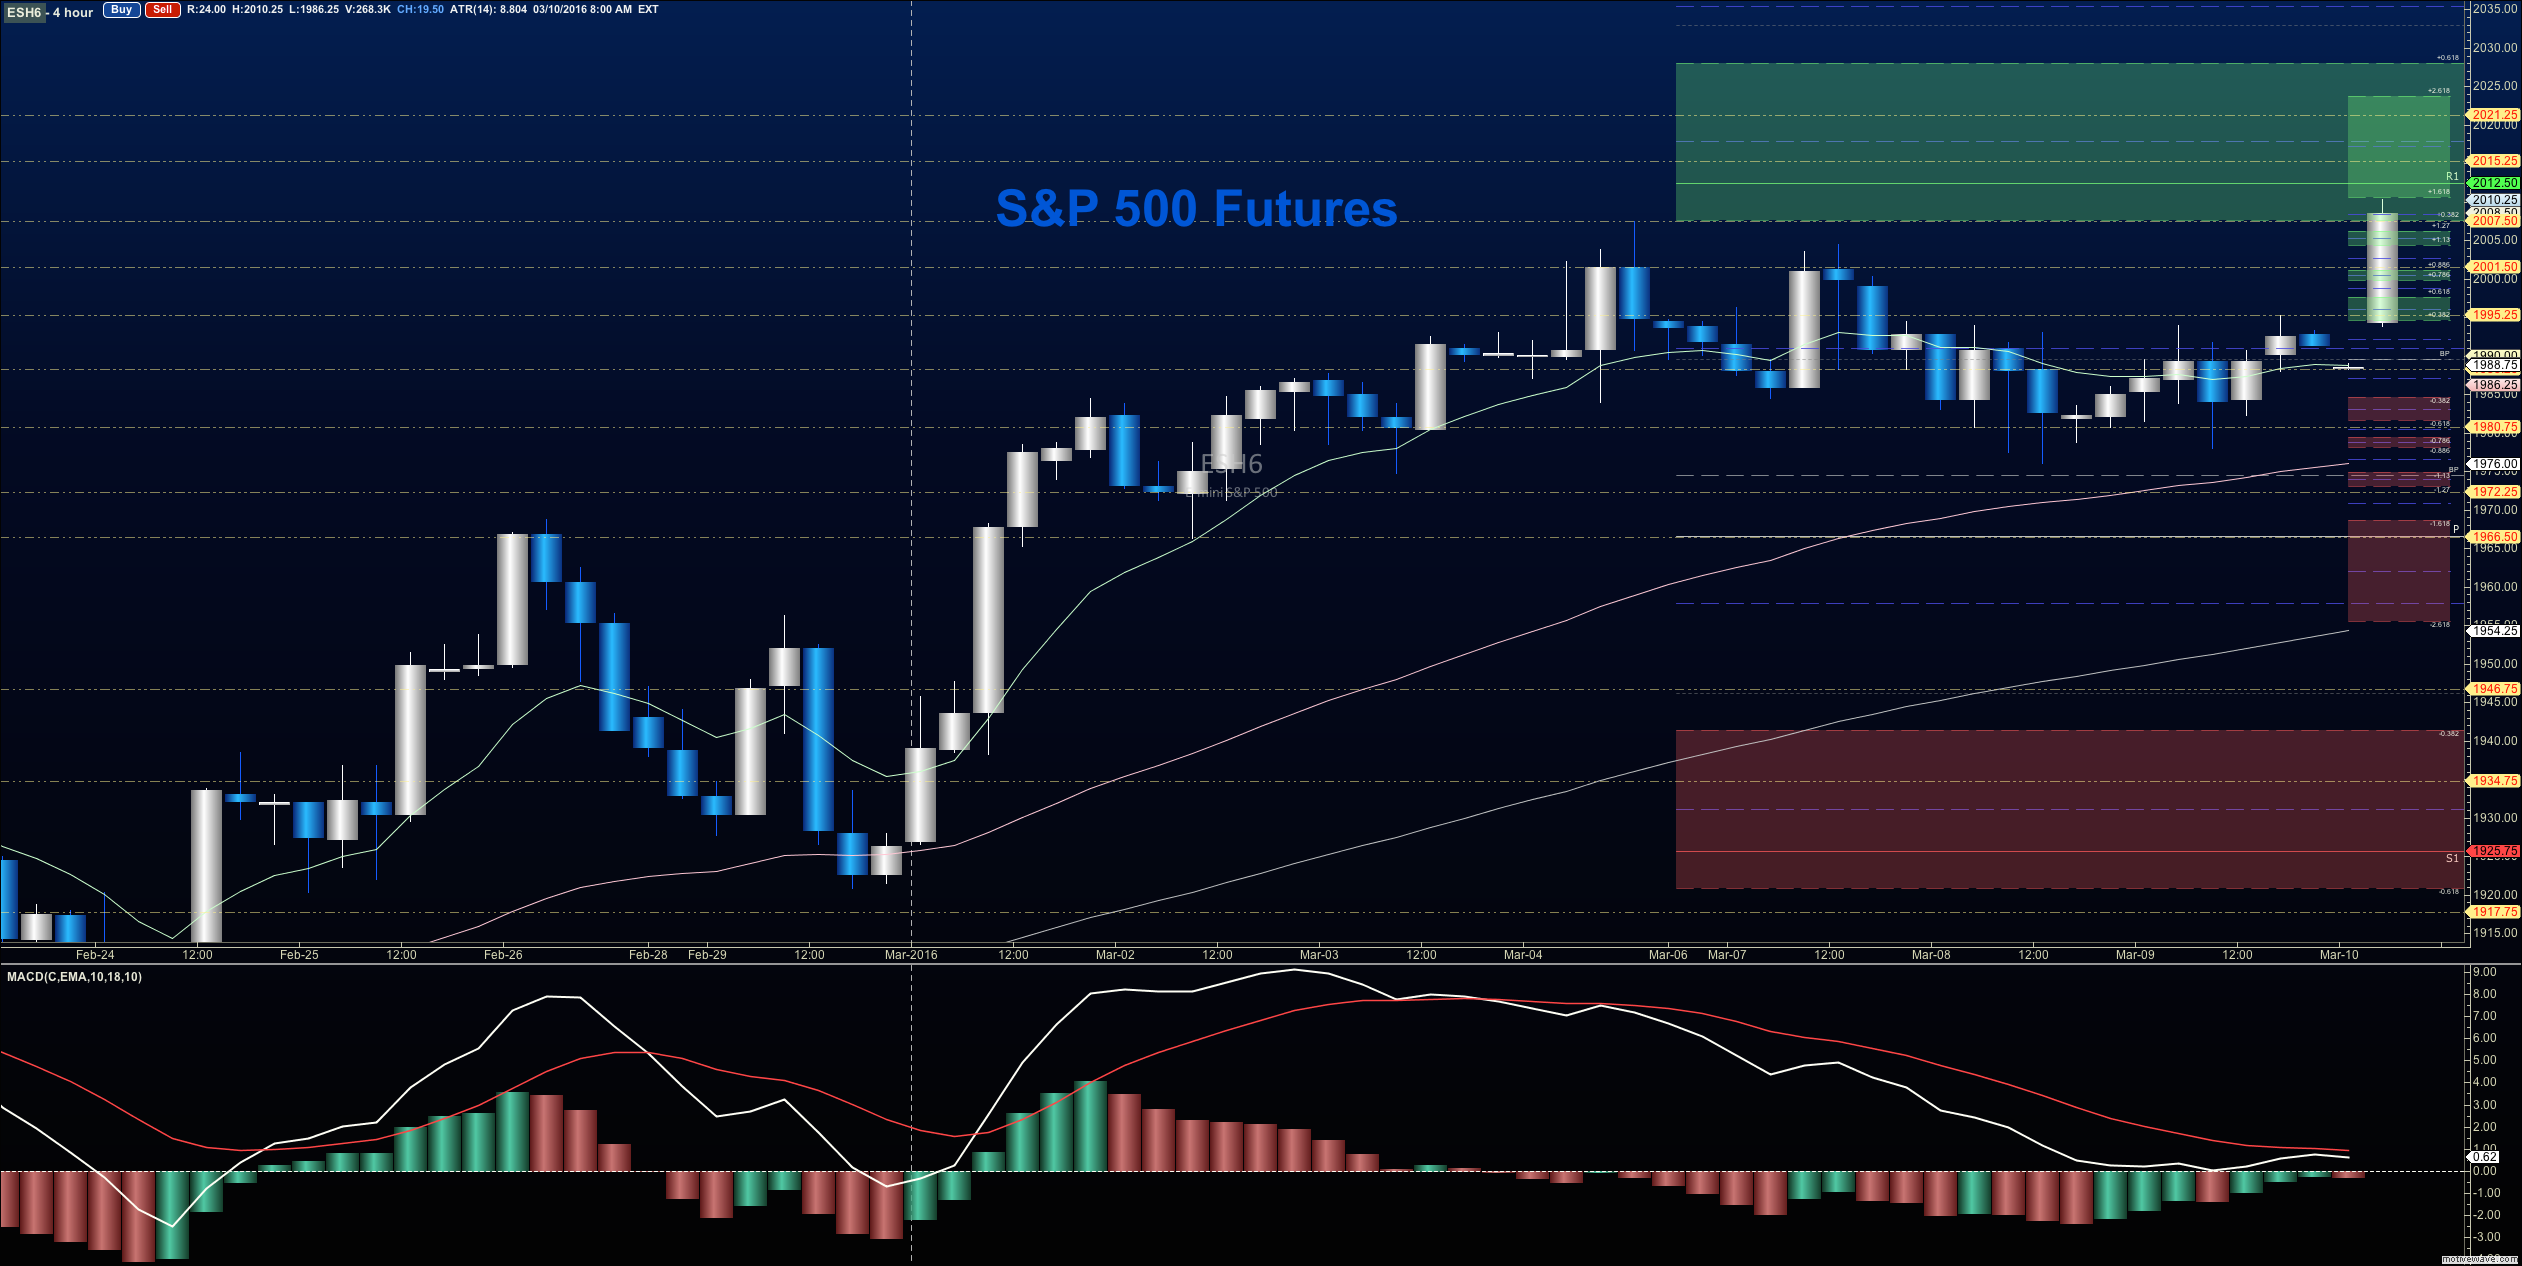
March 10 outlook for S&P 500 futures – Buyers hold steady in the march to test old resistance near 1999-2001.75. Overhead supply is somewhat formidable here, as many traders are betting on a move downward based on ‘oversold’ conditions, but buyers remain strong. 1991 will be the line in the sand sellers will need to break to force buyers into more tentative positions.
Upside motion has the best setup on the retest of 1999.75 or a bounce off 1994.5 with positive momentum. I use the 30min to 1hr chart for the breach and retest mechanic. Targets from 1994.75 are 1997.25, 1999, 2000.25, 2003.25, 2007.5, and if we can catch a bid there, we could expand back into 2011.25 and beyond. The next big resistance test sits at the region between 2011-2015, then 2021-2025. Watch the higher lows across stock market futures to keep you on the right side of the long trade. Charts are firming up, but expect pullbacks into higher support.
Downside motion opens below the failed retest of 1998.5 or at the failed retest of 2011 with negative divergence – but really watch for the higher lows there- the higher lows will signal that your short is ill positioned. Retracement into lower levels from 2003.5 gives us the targets 1999.25, 1994.25, 1991.5, 1987.75, 1984.5, 1981.5, 1974.75, 1971.25, 1969.25 and perhaps 1964.5 if selling really takes hold.
Have a look at the Fibonacci levels marked in the blog for more targets.
If you’re interested in the live trading room, it is now primarily stock market futures content, though we do track heavily traded stocks and their likely daily trajectories as well – we begin at 9am with a morning report and likely chart movements along with trade setups for the day.
As long as traders remain aware of support and resistance levels, risk can be very adequately managed to play in either direction as bottom picking remains a behavior pattern that is developing with value buyers and speculative traders.
Thanks for reading.
Twitter: @AnneMarieTrades
The author trades stock market futures every day and may have a position in mentioned securities at the time of publication. Any opinions expressed herein are solely those of the author, and do not in any way represent the views or opinions of any other person or entity.


 – Warren Buffett’s Biggest Holding!")
