The stock market futures outlook for March 15 will be guided by how S&P 500 futures handle a test of support around 1997. Just a friendly reminder that this is Fed week and OPEX week so the action should begin to pick up into week’s end.
Sellers resumed control after a pop above resistance and have forced price back into congestion. As momentum suggested, we could not hold these breakout levels. Yesterday’s support levels noted at the 2002 -1997 range are now being tested.
If stock market futures fall below that congestion zone, then we may see S&P 500 futures test support between 1991.5 and 1994. Current overhead resistance sits at congestion near 2009-2015
The Morning Report: Charts Approach Congestion
Momentum on the four hour chart is positive, but drifting lower -suggesting that buyers will still show up at key support levels. Watch for lower highs to develop if sellers gain momentum. The bounces will become shallow if sellers are taking hold. The key to real reversal will be watching for lower highs to develop, and technical divergence to develop on the longer time frames.
Shorter time frame momentum indicators are sloping down – and we’ve broken trend a bit. That puts all the pressure on the buyers to recover and the slant of the trading day to sit with the sellers at this time.
See today’s economic calendar with a rundown of releases.
THE RANGE OF THURSDAY’S MOTION
Crude Oil Futures (CL_F)
Crude Oil outlook for March 15 – Oil prices begin another morning with a definite bearish slant- but support levels are holding currently. The buyers failed to hold support yesterday and have continued selling into deeper support.
Today, the trading ranges for crude oil are between 36.06 and 37.89 –with the burden of defense on the buyers at support of 36.06.
Moving averages in oil show mixed to negative momentum on longer time frames, as the loss of key levels near 36.89 have given sellers a bit more confidence that they can push the chart lower. Support levels for crude oil futures have been broken and that shifts the momentum and trend to negative. The first bounce into 36.89 and the battleground at 36 to 36.34 will give us clearer trading direction.
Intraday long trading setups on crude oil suggests a long off 36.94 positive retest (check momentum here), or 36.44 bounce and positive retest into 36.7, 36.89, 37.38, 37.64, 37.85 and if buyers hold on, we’ll see a return to 38.14 to potentially 38.46.
Intraday short trading setups suggest a short below a 36.87 failed retest with negative divergence, or the failed retest of 36.7 sends us back through targets at 36.44, 36.25, 36.09, 35.81, 35.57, and back into familiar regions seen near 35.19 to 35.06, if sellers hang on.
Have a look at the Fibonacci levels marked in the blog for more targets.
E-mini S&P 500 Futures (ES_F)
Below is a S&P 500 futures chart with price support and resistance trading levels for today. Click to enlarge.
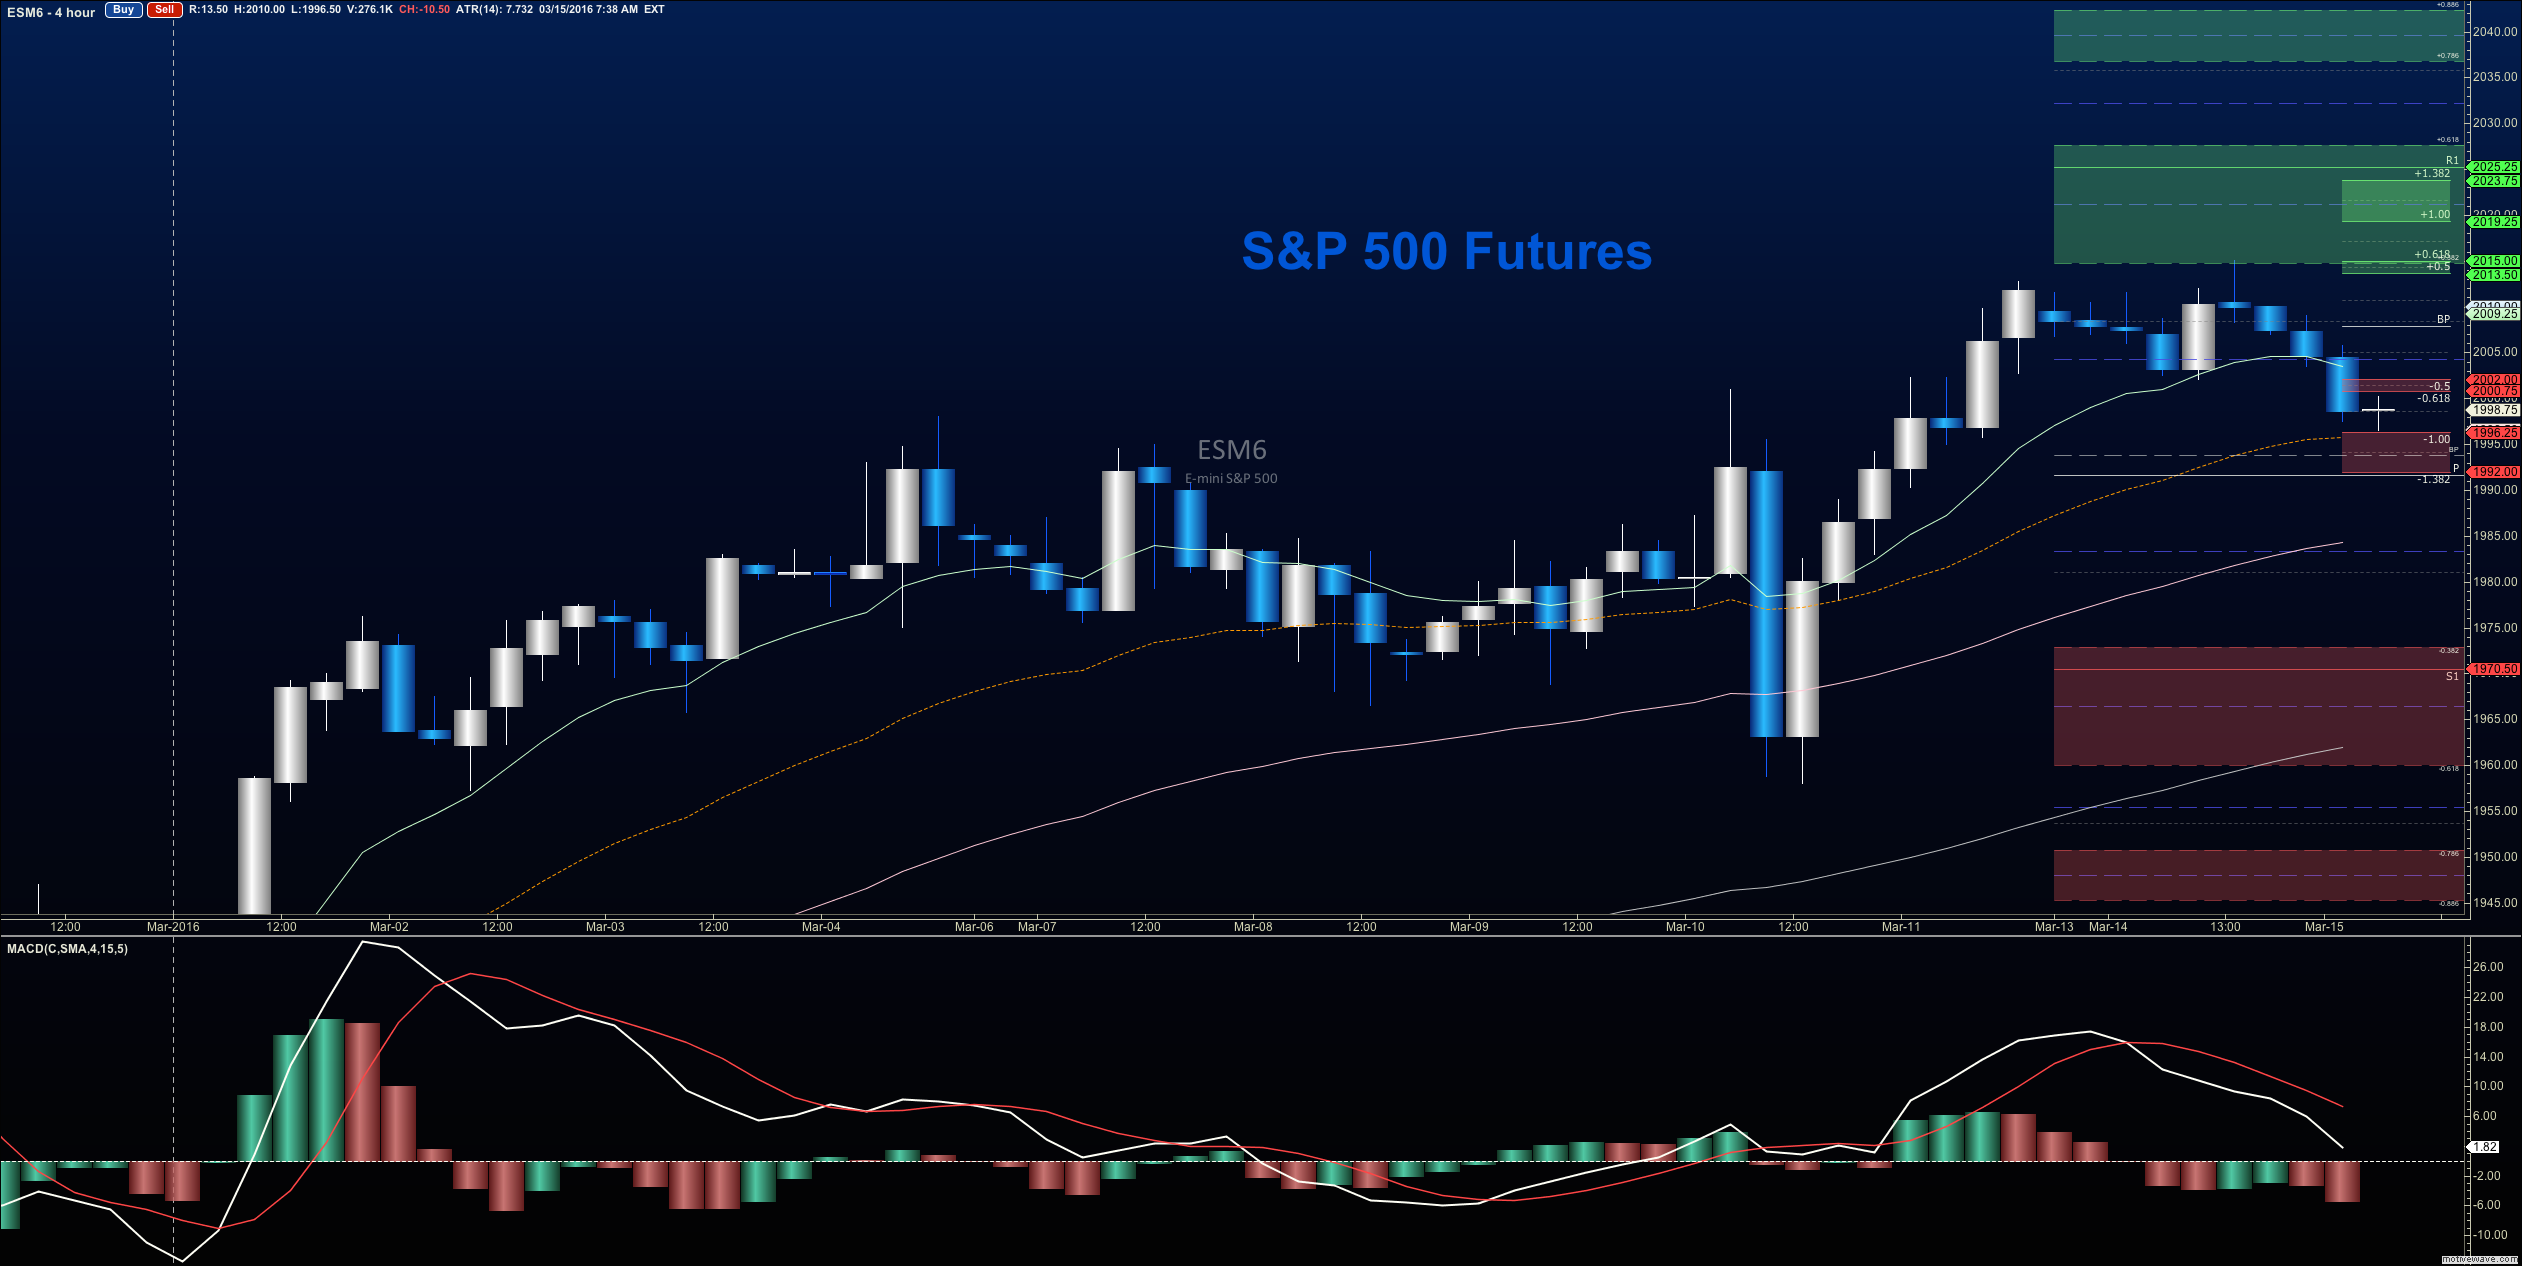
March 15 outlook for S&P 500 futures –Though the charts stretched higher yesterday, there was insufficient buying power to keep the new levels steady. Overhead supply remains strong– it still won’t be easy for buyers to breach resistance and hold. The grind north should send us to a lower high in this formation. Bounces should be sold.
Upside motion for S&P 500 futures has the best setup on the positive retest of 2001.5 or a bounce off 1997 with positive momentum. I use the 30min to 1hr chart for the breach and retest mechanic. Targets from 2001.5 are 2005.5, 2007.5, 2009.25, 2012.25, and if we can catch a bid there, we could expand into 2015.25, 2021.25 and 2023.5. The next resistance tests remain between 2011-2015.75, then 2021-2025. Watch the higher lows to keep you on the right side of the long trade. Charts are firming up, but expect pullbacks to find buyers – see the fib zones for support regions.
Downside motion opens below the failed retest of 1997 or at the failed retest of 2005 with negative divergence – but really watch for the higher lows there- the higher lows will signal that your short is ill positioned. Retracement into lower levels from 2005 gives us the targets 2002.25, 2000.5, 1997.25, 1994.25, 1991.5, 1987.75, 1984.5, 1981.5, 1974.75, 1971.25, 1969.25 and perhaps 1964.5 if selling really takes hold, but that seems quite unlikely at this point in the day.
If you’re interested in the live trading room, it is now primarily stock market futures content, though we do track heavily traded stocks and their likely daily trajectories as well – we begin at 9am with a morning report and likely chart movements along with trade setups for the day.
As long as traders remain aware of support and resistance levels, risk can be very adequately managed to play in either direction as bottom picking remains a behavior pattern that is developing with value buyers and speculative traders.
Thanks for reading.
Twitter: @AnneMarieTrades
The author trades stock market futures every day and may have a position in mentioned securities at the time of publication. Any opinions expressed herein are solely those of the author, and do not in any way represent the views or opinions of any other person or entity.

: Creating Bullish Divergence?")


: Creating Bullish Divergence?")

