Traders are battling between long and short positions across stock market futures as the action is getting a bit extended here into April.
Yet traders getting in front of the perceived short continue to drive charts up with the bulls here looking to test of higher levels. S&P 500 futures support resides between 2064.5 and 2061.5, and below that we have the 2050.5-2055 levels. Resistance sits between 2071.5 and 2076. If buyers catch a bid up here we could stretch all the way to 2092; interestingly fueled by both longs confident in the move up and shorts getting squeezed.
Momentum on the four hour chart for S&P 500 futures is bullish, so buyers remain in control, but tighter time frames still suggest a pullback into support – but those pullbacks will create bounce opportunities at this stage.
Shorter time frame momentum indicators are positive, but fading. Downside motion should be limited, however, as the balance between buyers and sellers seem even in the neutral zone. A steep selloff of stock market futures will likely find buyers coming into hold levels from very steep retracements.
See today’s economic calendar with a rundown of releases.
THE RANGE OF THURSDAY’S MOTION
Crude Oil Futures (CL_F)
Outlook for April 4 – A support test of 36.15 gave us a sharp bounce into 36.9 before bumping into overhead supply. The value area is currently near this bounce zone at 36.15. Failure to hold here could force us into 35.34.
Today, the trading ranges are between 35.34 and 37.7 – with a battleground near 36.9- support areas near 37.34 and resistance near 38.42.
Moving averages in oil have shifted negative on tighter time frames, but negative momentum on longer intraday time frames continues to lift on the weekly time frame- suggesting a war between buyers and sellers. Resistance is now lower between 38.4 and 37.7; deeper support is likely near 35.34 and 34.7.
Intraday long trading setups on crude oil suggest a long off a 36.7 positive retest (check momentum here), or 36.14 positive retest on the pullback into targets of 36.61, 36.96, 37.24, 37.42, 37.7, and if buyers hold on, we’ll see 38.31 to potentially 38.76, and 39.04.
Intraday short trading setups suggest a short below a 37.7 failed retest with negative divergence, or the failed retest of 37.13 sends us back through targets at 37.48, 36.9, 36.46, 36.24, 36.04, and 35.84 to 35.4, if sellers hang on.
E-mini S&P 500 Futures (ES_F)
Below is a S&P 500 futures chart with price support and resistance trading levels for today. Click to enlarge.
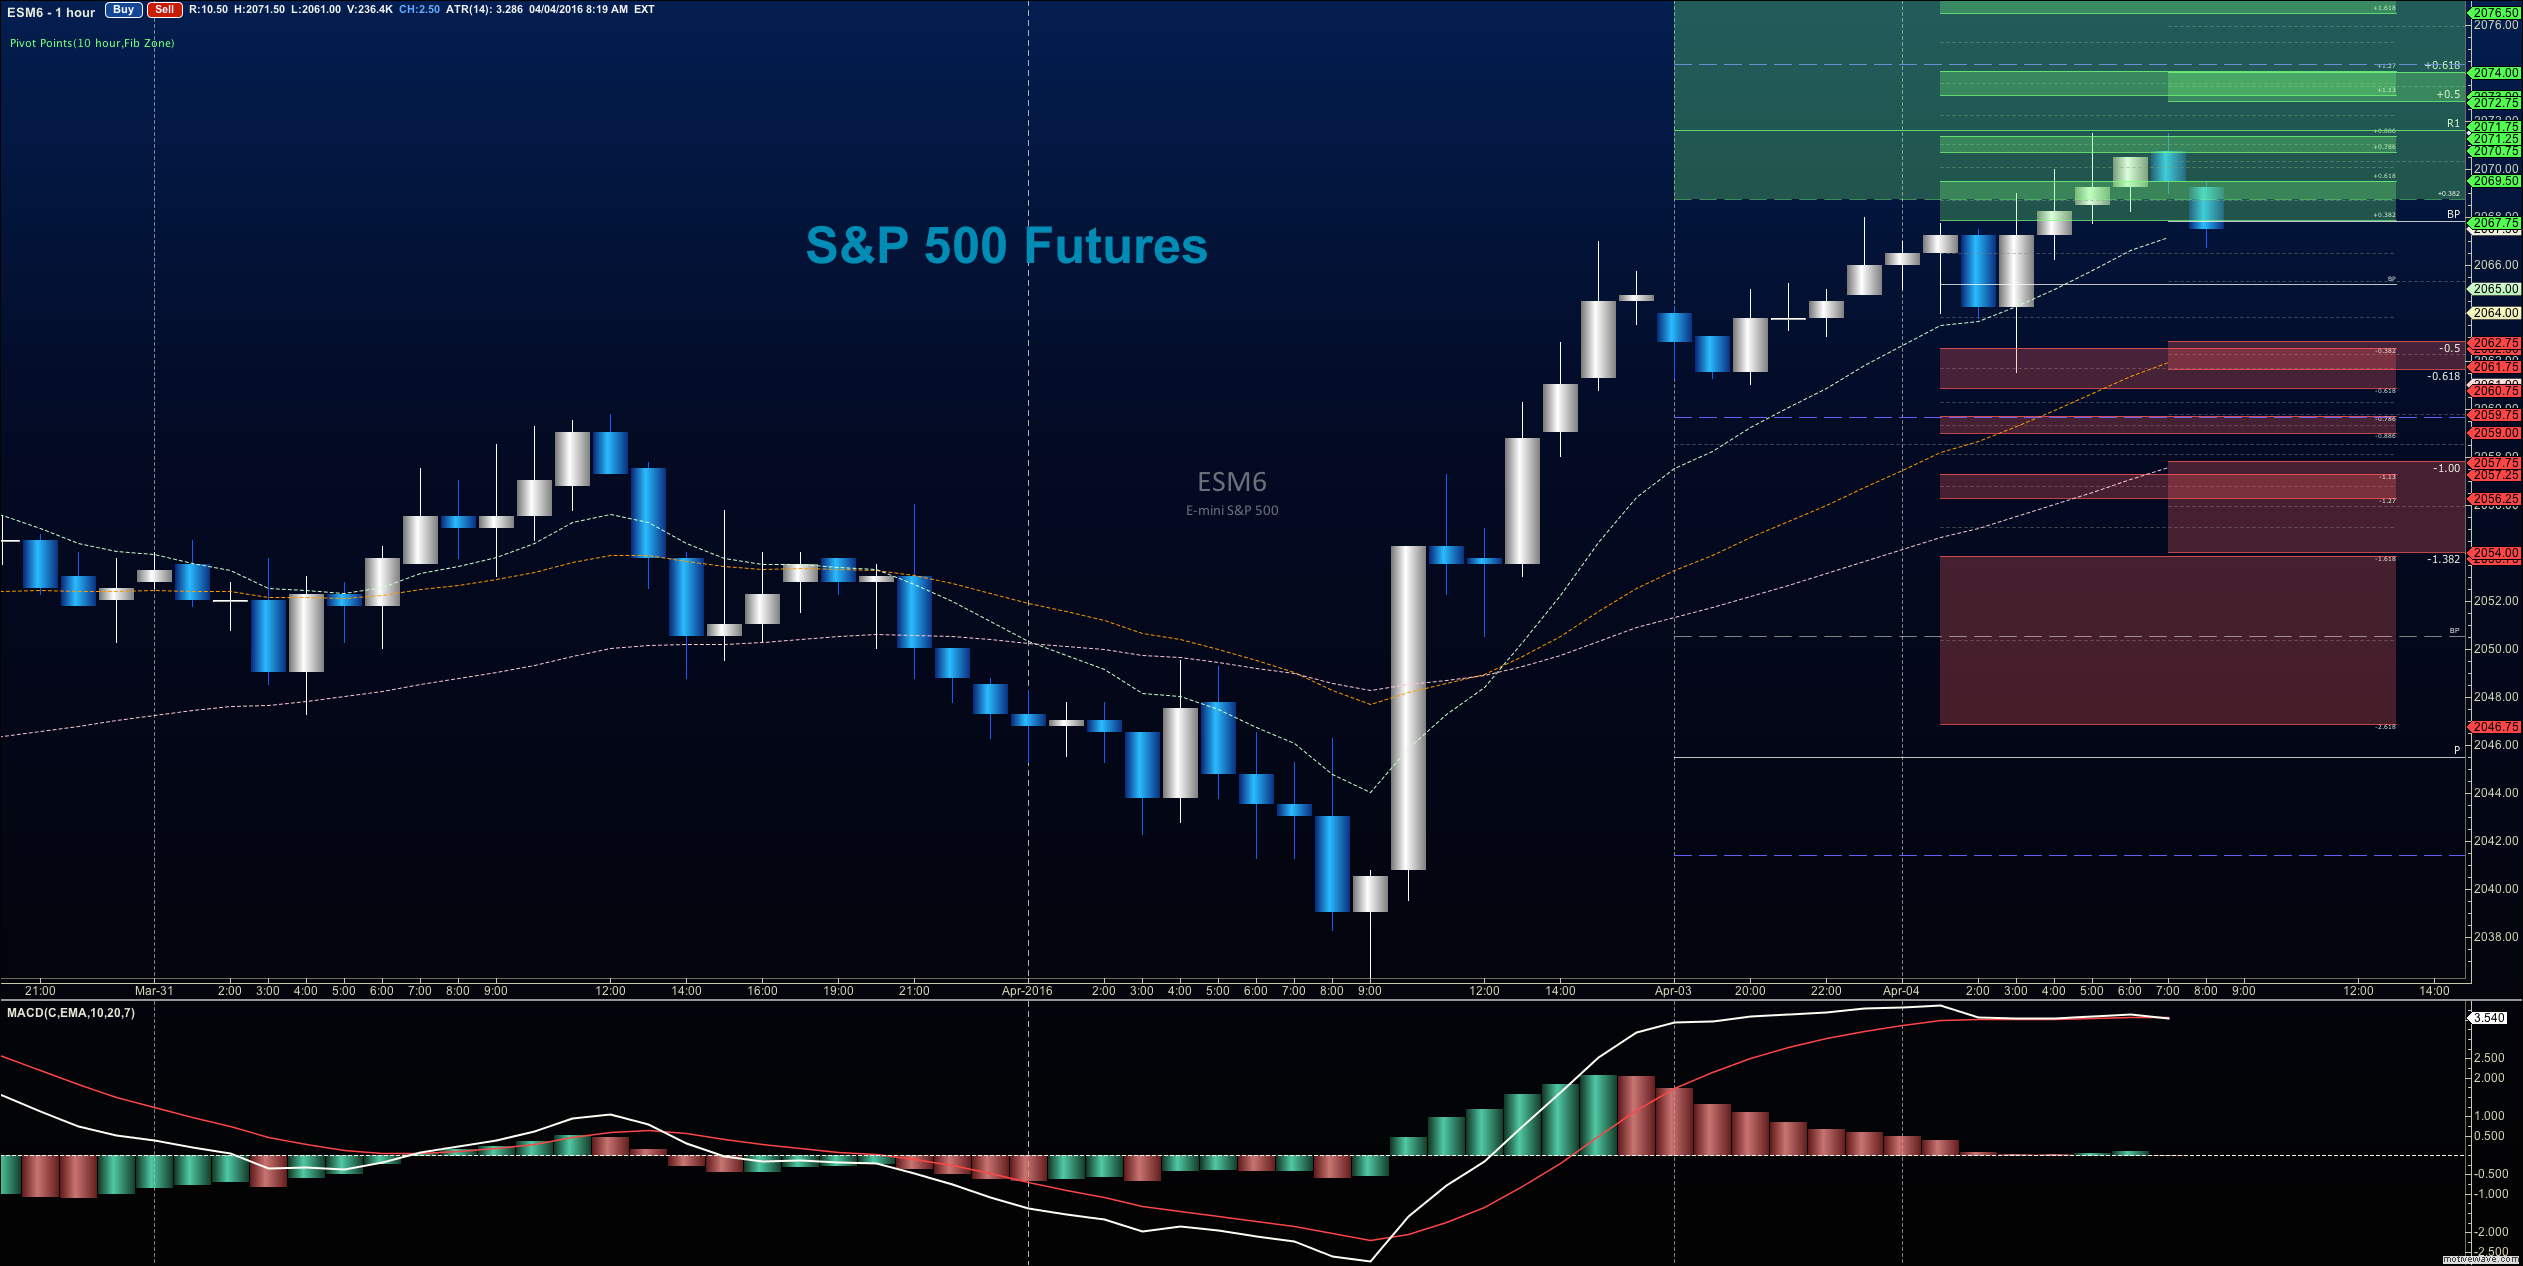
Outlook for April 4 – The artificial tandem that traders are building with the oil chart continues to affect chart action. The levels between 2071.5- 2075.25 serve as front line resistance, with 2064- 2061.5 now as support. Stretches north could see 2089.75 if the shorts help feed the move up, and deep support could now be near 2044.5, but I doubt the chart has that kind of range today. Buyers remain in control of these charts.
Upside motion has the best setup on the positive retest of 2064.5 or a breach and retest of 2061.5 with positive momentum. I use the 30min to 1hr chart for the breach and retest mechanic. Targets from 2061.5 are 2064.5, 2067.5, 2069.5, 2071.5, 2074.5, 2075.5, 2078.75, and if we can catch a bid there, we could expand into 2081.5, 2084.25, and 2092.5. Longs are still trending over the bigger picture for now, but momentum remains damp.
Downside motion (trending intraday) opens below the failed retest of 2069.5 or at the failed retest of 2075.5 with negative divergence (careful here – remember buyers are in charge). Retracement into lower levels from 2069.5 gives us the targets 2067.75, 2064.25, 2061.75, 2059.5, 2056.5, 2054.25, 2050.75, 2047.75, 2044.50, and perhaps 2039.5 if selling really takes hold.
If you’re interested in the live trading room, it is now primarily stock market futures content, though we do track heavily traded stocks and their likely daily trajectories as well – we begin at 9am with a morning report and likely chart movements along with trade setups for the day.
As long as traders remain aware of support and resistance levels, risk can be very adequately managed to play in either direction as bottom picking remains a behavior pattern that is developing with value buyers and speculative traders.
Thanks for reading.
Twitter: @AnneMarieTrades
The author trades stock market futures every day and may have a position in mentioned securities at the time of publication. Any opinions expressed herein are solely those of the author, and do not in any way represent the views or opinions of any other person or entity.


 Ready To Break Out?")