Back in August I published an update on the credit markets.
Of note, I suggested that “This bear market has been different from any since the mid-90’s because it has not been led by credit. But that does not mean that an accident in corporate bond-land won’t result in more pain for stocks. The trick – and not an easy one – is to look-out for the skid-marks preceding the wreck. So far there aren’t many, but it is worth noting that the two-month aggregate issuance of corporates in June and July was among the lowest in the last 9 years for a 2-month period. (I’m excluding the November- December months because seasonally December is a “dead” month for new bond sales).” – https://filzucchi.substack.com/p/corporate-bond-market-different-path
With the S&P 500 Index retesting the lows, it’s worth revisiting if the above still holds true. Below are several charts showing whether the drivers of the June lows in stocks are also the culprit for last week’s retest.
Note: for all charts the scale is inverted for $SPY (S&P 500 ETF). Also note that this analysis was written over the weekend (September 25th).
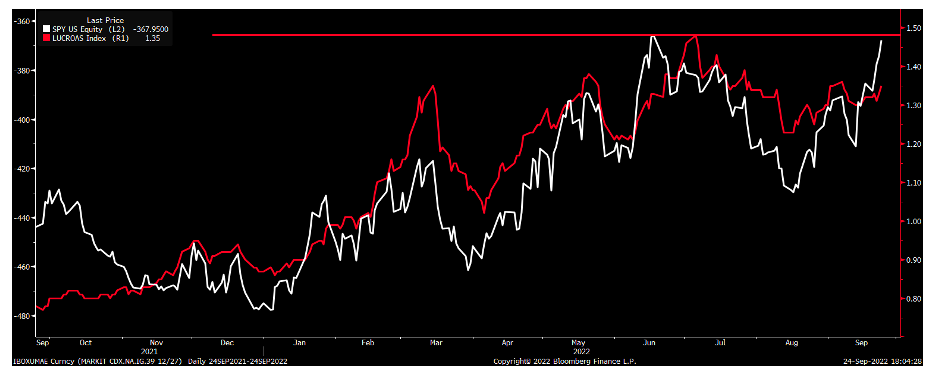
First the “good news”. Investment Grade (“IG”) corporate spreads remain below the 150bps level which is generally viewed as the point where corporate credit stops being supportive of equities, particularly as it pertains to borrowing money to fund buybacks. You can also see that IG spreads (red line), which peaked shortly after the SPY bottomed (white line), are not retesting the wide levels seen in June. That is a positive divergence.
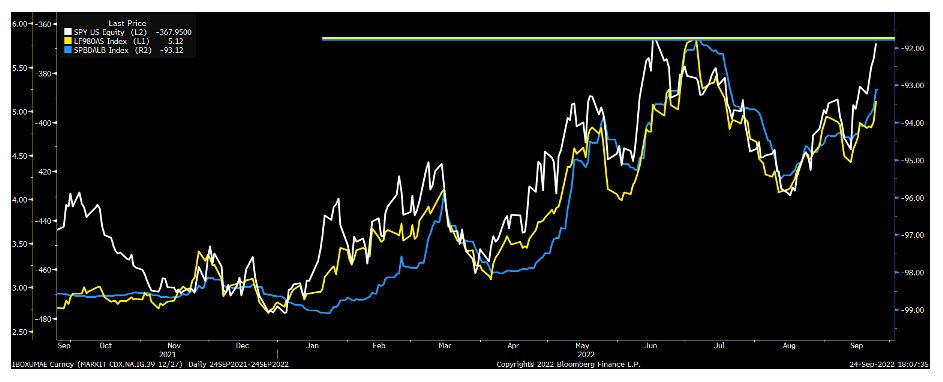
The same applies to High Yield corporate spreads (yellow line) and the prices of leveraged loans (blue line)
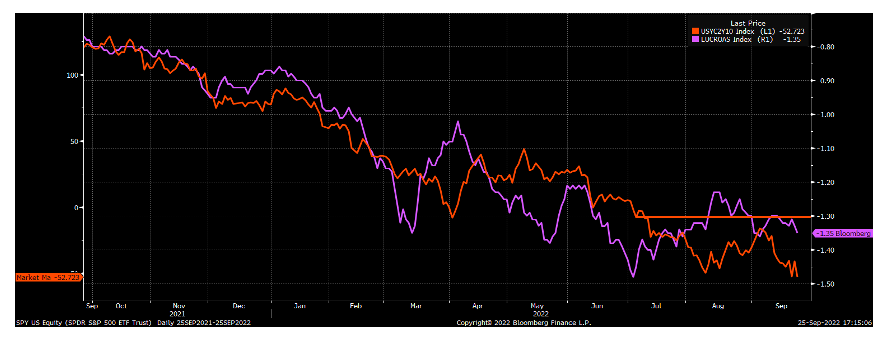
Lastly, the 2s10s yield curve (orange line below) is now way more inverted than it was in June, but it still has not dragged the IG spreads wider (purple line / inverted scale). For more discussion on the shape of 2s10s curve as it pertains to credit spreads, please see https://filzucchi.substack.com/p/the-2-10-yield-curve-matters-a-lot
Now for the bad news. What coincided/drove stocks to the June lows, has not only retested the June levels, but has exceeded them.
This next chart shows the 2yr (blue line) and the 10yr (red line) Treasury rates. Both those yields have taken out the June highs (marked by the respective horizontal lines) and have jumped significantly higher.
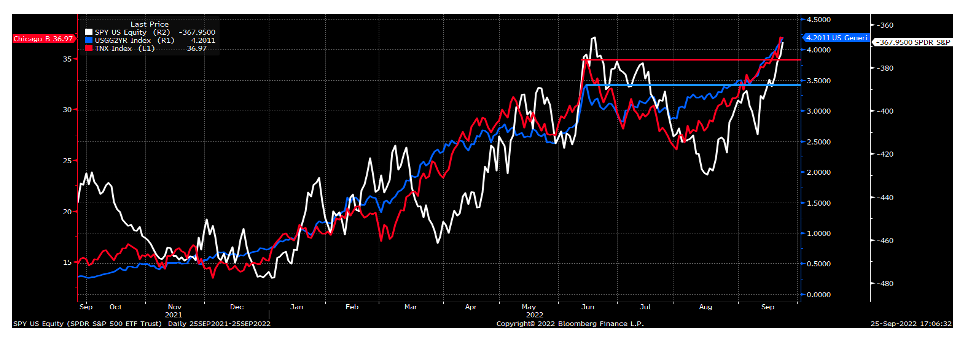
Connected to the rise in the 2yr and 10yr yields, but worse from the standpoint of “contagion risk” around the world, is the US Dollar Index (red line below), which has blown away the June highs (red horizontal line) and is running higher in what feels like a dangerous/disorderly fashion.
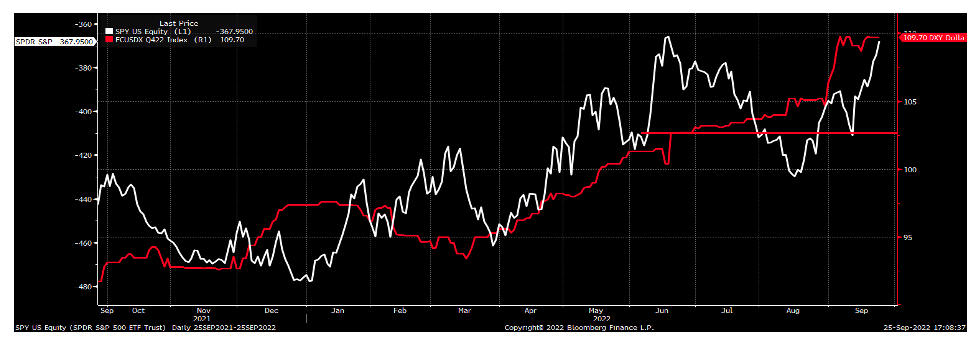
To recap: so far corporate spreads are not adding pressure to the drop in equities, but the higher Treasury Yields / rising US Dollar which drove stocks to the June lows are now even worse.
One last item to watch carefully in my opinion. September is the single most important month of the year for corporate bond issuance and, so far, it has been a miserable month on that front. Between 2013 and 2021 September has had average corporate bond issuance of $201 billion; the worst September in that series was in 2015, which came in at $131 billion. The 2022 month-to-date total is $88 billion.
Furthermore, the sale of the Citrix LBO debt was a pretty much a bust and must be scaring the bejesus out of anyone thinking of funding more M&A activity. Both these “internals”, if they persist or worsen, are very likely to spill into corporate spreads, which would become a whole new set of problems for stocks.
Twitter: @FZucchi
The author may have positions in mentioned securities at the time of publication. Any opinions expressed herein are solely those of the author, and do not in any way represent the views or opinions of any other person or entity.

: Showing Some Signs of Emerging Strength")

