Last week the S&P 500 Index (SPX), after hitting a new cycle high mid-week, closed down for the five-day period reflecting global growth concerns.
Economies in Europe and China continue to deteriorate causing uneasiness that the problems overseas could affect the U. S. markets. News about Brexit and the U.S. trade discussions with China are raising additional concerns.
The yield on the 10-year German government bond fell below zero on Friday for the first time since 2016. The yield curve briefly inverted (10-year U.S. Treasury note fell below the yield on the 3- month and one-year U.S. Treasury bills) for the first time since 2007, which has in the past signaled a recession.
There are signs that our economy is not as robust as last year such as the decline in capital spending in the third and fourth quarters of last year.
However, sales of previously owned homes rose in February at the fastest rate since 2015. Wages are growing at 3.4%, the best since 2009 and most projections are for that to continue. The Leading Economic Index (LEI) rose in February with the data suggesting a loss of momentum but no signs of negative growth approaching.
Federal Reserve Chairman Jerome Powell echoed a similar message at last week’s press conference stating the central bank projects no new rate hikes this year and an end to winding down its large bond portfolio due to rising wages, low unemployment and higher consumer confidence.
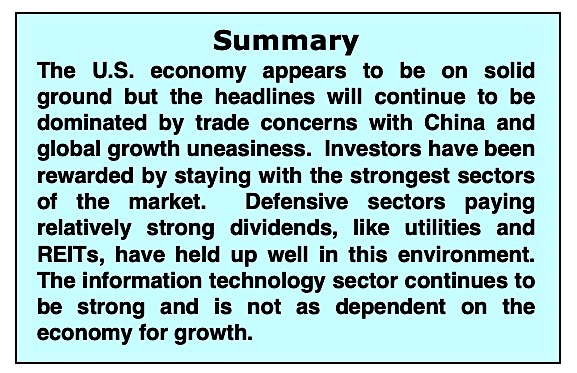
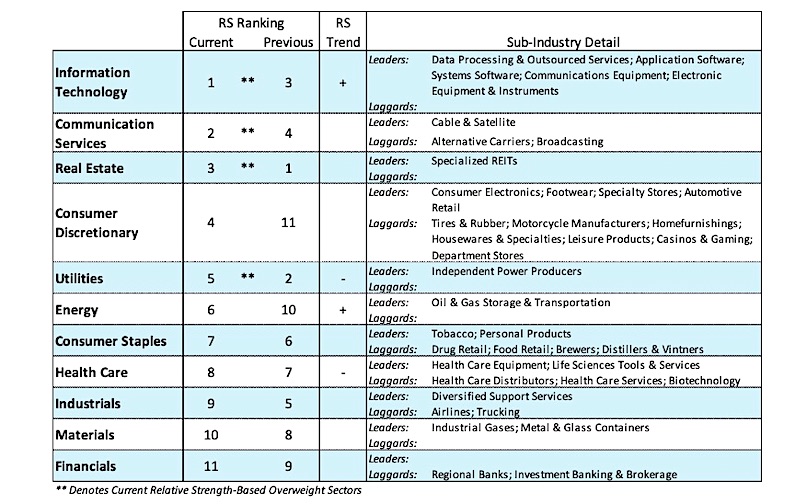
While the U.S. economy appears to be on solid ground, the headlines will most likely continue to be dominated by trade concerns with China and anxiety over the prospects for global growth. Investors have been rewarded by staying with the strongest sectors in the market. Defensive sectors with strong dividends, like utilities and REITS, have held up well in this environment. The information technology sector continues to be strong and is not as dependent on the economy for growth.
Technical indicators for the stock market, including negative divergences and rising investor optimism (from a contrary opinion perspective), are flashing yellow. Although the S&P 500 Index climbed to a new recovery high last week this was unconfirmed by the Dow Industrials, Dow Transports, NY Composite Index and Russell 2000 small-cap index.
Additionally, the S&P financial sector has plunged to the lowest level versus the S&P 500 since October 2016. This is important given that the financial sector is considered a reliable indicator of the direction of interest rates, the economy and equity markets.
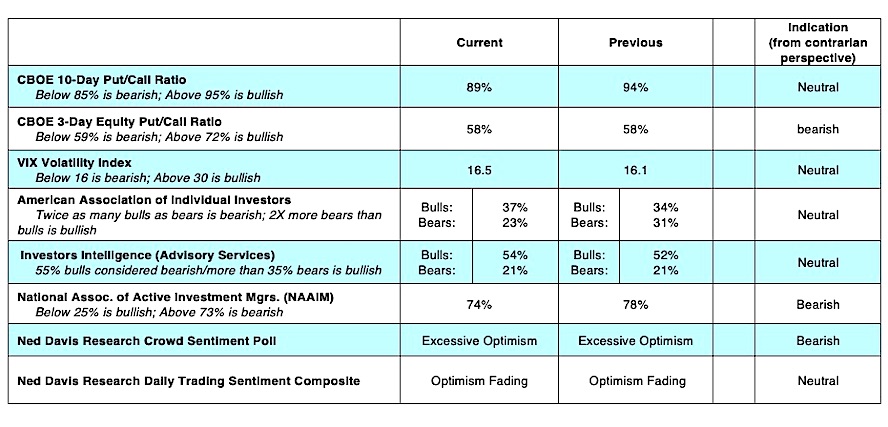
In a healthy bull market, most areas are in harmony with the primary trend which is missing in the current example. The fact that just 54% of S&P 500 stocks are above their 200-day moving average versus 65% at the mid-February peak is another indication that market breadth is deteriorating. When the S&P 500 was moving through the 2800-2850 zone in January 2018, more than 80% of its stocks were above their 200-day moving average. Measures of investor psychology are also disconcerting.
The most recent report from Investors Intelligence, which tracks the opinion of Wall Street letter writers, show the bullish camp expanded for the fifth straight week and is sitting at the highest level since the first week in October 2018. Investor optimism/complacency is also seen in the reports from the Chicago Board of Options Exchange (CBOE) that show the demand for puts vanishing last week. Investors buy puts in anticipation that stocks will decline over the near term.
Further evidence of investor enthusiasm for stocks is found by the fact that $25 billion flowed into U.S. equity ETFs last week. According to Ned Davis Research, this was the third-largest weekly inflow over the last two years and the highest since the S&P 500 peaked in September 2018.
Twitter: @WillieDelwiche
Any opinions expressed herein are solely those of the author, and do not in any way represent the views or opinions of any other person or entity.


