The stock market powered forward last week once trade tensions cooled, as I pointed out in may latest Market Week show.
The S&P 500 Index INDEXSP: .INX rose 28 points to 3007, an increase of 1%.
But that’s not the entire story. The market appears to be rotating into value stocks, with the Guggenheim S&P 500 Pure Value ETF (RPV) rallying sharply last week.
This may be another sign of trade optimism, as many value stocks have been hurt in the trade war.
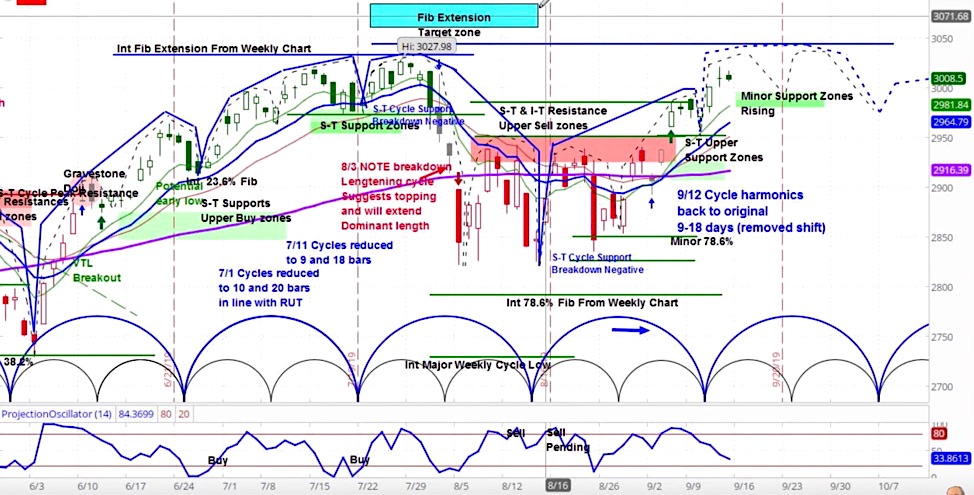
Our approach to technical analysis uses market cycles to project price action, as depicted in the chart below.
In the previous week, we saw the double gap up that was bullish. As such, we do not see a significant near term decline as likely. (We believe a drop from the attack on Saudi oil facilities will be temporary.)
Our projection is for range bound price action. Our support zone is 2080-2995, and our resistance is between 3028-3043, which we believe will be tested by the 3rd or 4th week of September.
And we expect even higher prices before a peak and start of bear market in 2020. Read more below.
S&P 500 (SPX) Daily Chart
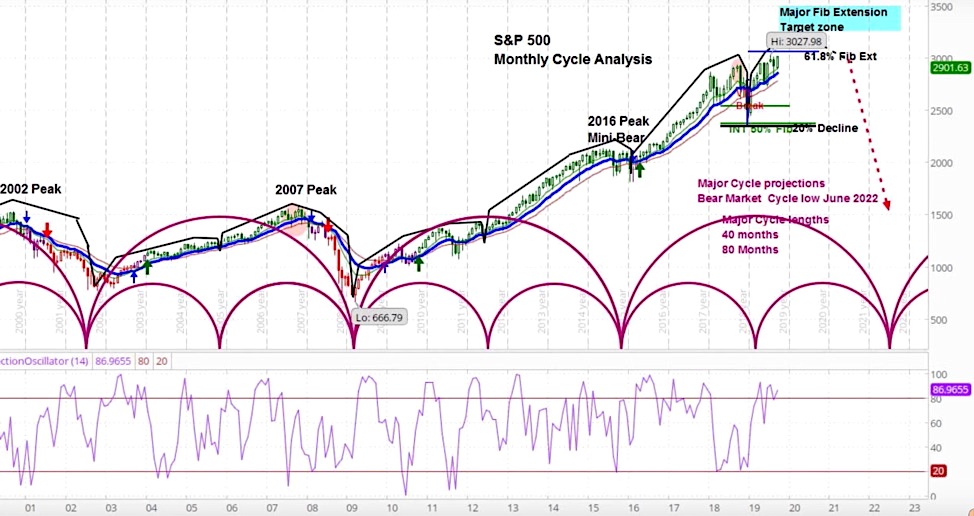
Our analysis is grounded in longer term market cycles, such as those shown in the monthly chart below.
Each cycle lasts 80 months and is divided into two minor cycles. We are currently early in the second minor cycle, which, joining with the major cycle, has a projected low in June 2022.
Given this, for the longer term, we believe the SPX will be able to make upward progress until early 2020 before the start of a bear market. By Q2, we expect a major top to have formed.
S&P 500 (SPX) Monthly Chart
The next chart zooms into the current cycle on the monthly chart. It is important to note that momentum has remained positive throughout the dips in the past year, even during the big break in December 2018.
Thus, upward inertia remains in place. However, I do believe that further upside will be limited by our Fibonacci extension zone beginning at $3250.
S&P 500 Monthly Chart (focused view)
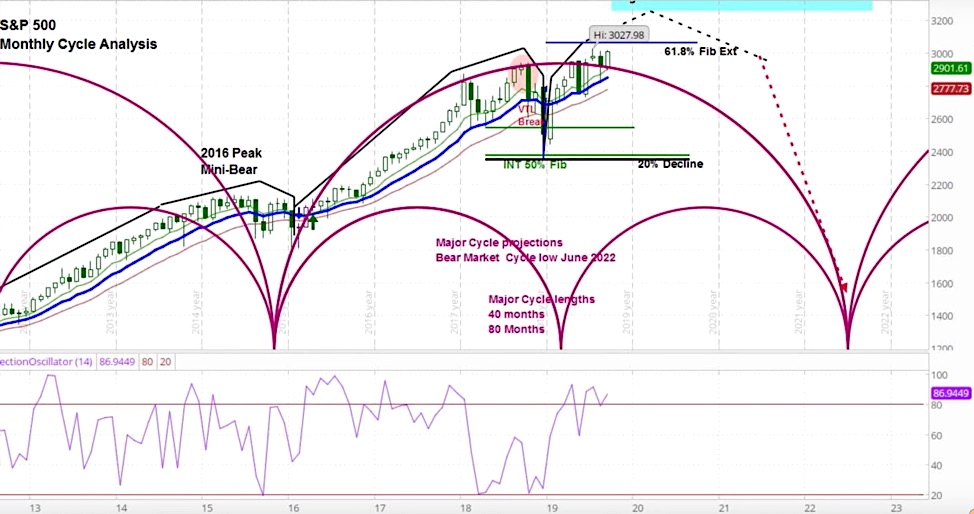
Once a major top is in place, I believe a significant bear market will start. Cyclically, this should last into 2022, as shown by the trough in both cycles on the chart. Note that the average bear market runs 14 months and brings a decline of over 33%. After this historical length of a secular bull, the correction would be expected to be above average.
For a more detailed analysis of these charts, check out the latest episode of the askSlim Market Week show.
Twitter: @askslim
Any opinions expressed herein are solely those of the author, and do not in any way represent the views or opinions of any other person or entity.


: Showing Some Signs of Emerging Strength")
