The S&P 500 (NYSEARCA:SPY) enjoyed a relief rally this week. Enjoy it while it lasts…
Stocks were up last week, but from here the market cycle points lower.
In last week’s outlook, we called for a short-term bounce. But, as we have mentioned for several weeks, the stock market is in a correction / declining phase.
S&P 500 Analysis and Market Cycle Outlook:
- Stocks rose last week, with the S&P 500 (SPX) index up 53 points to 2641, an increase of 2%, as the bounce in stocks that we noted last week proceeded apace.
- The week’s price action confirmed again that we are in a new market environment, as the volatility that began in the previous month continued with a vengeance.
- Our projection this week is for stocks to attempt a rise early and then fall, as the declining phase of its current market cycle increases in intensity.
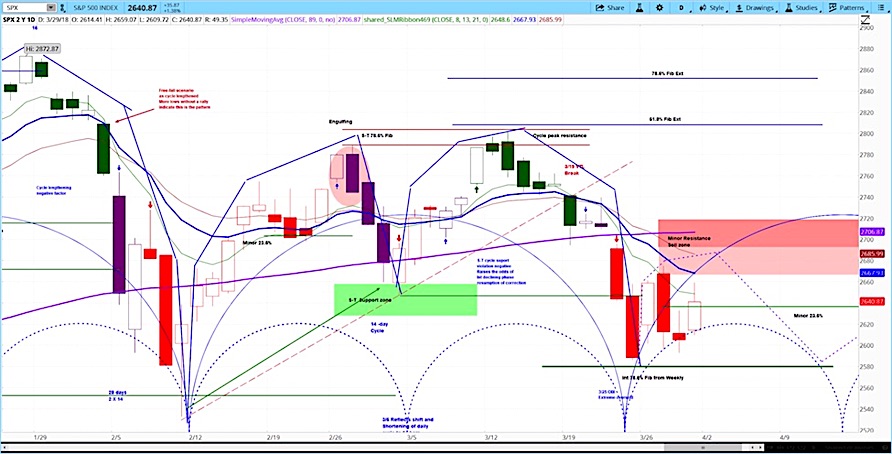
S&P 500 (SPX) Chart with Daily Bars
On Monday, the US and South Korea announced that they had reached trade deal, and news later arose that the US and China were in talks on matters related to trade policy. The markets took this as a sign that a global trade war was less likely, and stocks exploded, with the Dow Jones Industrial Average ($DJI) up 670 points, which was its best day since 2015.
Yet President Trump reminded the markets on Tuesday that we were not yet in the clear as far as his trade policy relates to China. It surfaced that the Treasury Department was examining technology sectors of strategic importance, such as semiconductors and 5G communications, that could potentially be banned from foreign investment. Likewise, concerns continued to grow that companies handling big data were increasingly likely to face government regulation.
On Wednesday, it emerged that Trump was considering ways to reap greater tax revenue from Amazon (AMZN), whom he believes has benefitted at the expense of taxpayers. AMZN fell $66 on the day, or about 4%, but was down as much as $120 intraday as the panic intensified.
On Thursday, the markets came back a bit after the Labor Department released initial jobless claims of 215,000, lower than the 230,000 expected and also lower than the previous figure of 227,000.
On Friday, the US markets were closed in observance of an official market holiday. As such, for the week, gold was down 1.8% last week, oil was down 1.5%, the dollar was up 0.8%, the euro was down 0.2%, and bonds were up 1.1%.
Our approach to technical analysis uses cycle analysis to project price action. Our projection for the S&P 500 (SPX) in the coming week is for a potential continuation of the bounce that began last week into the resistance zone of $2666 to $2692. Once it peaks, our projection is for a new wave of selling, as stocks begin the declining phase of their current market cycle.
For an introduction to cycle analysis, check out our Stock Market Cycles video, or watch the askSlim Market Week show every Friday on our YouTube channel. The latest episode is below.
Here’s our latest askSlim Market Week video:
Twitter: @askslim
Any opinions expressed herein are solely those of the author, and do not in any way represent the views or opinions of any other person or entity.


