It happened again. Over the years, it seems like nearly every time I go on vacation, the all knowing Ms. Market rips higher or cascades lower.
It has happened three times since the beginning of October. So of course, it has been a volatile period for stocks over the past two months, so maybe I just couldn’t avoid the stock market volatility this time.
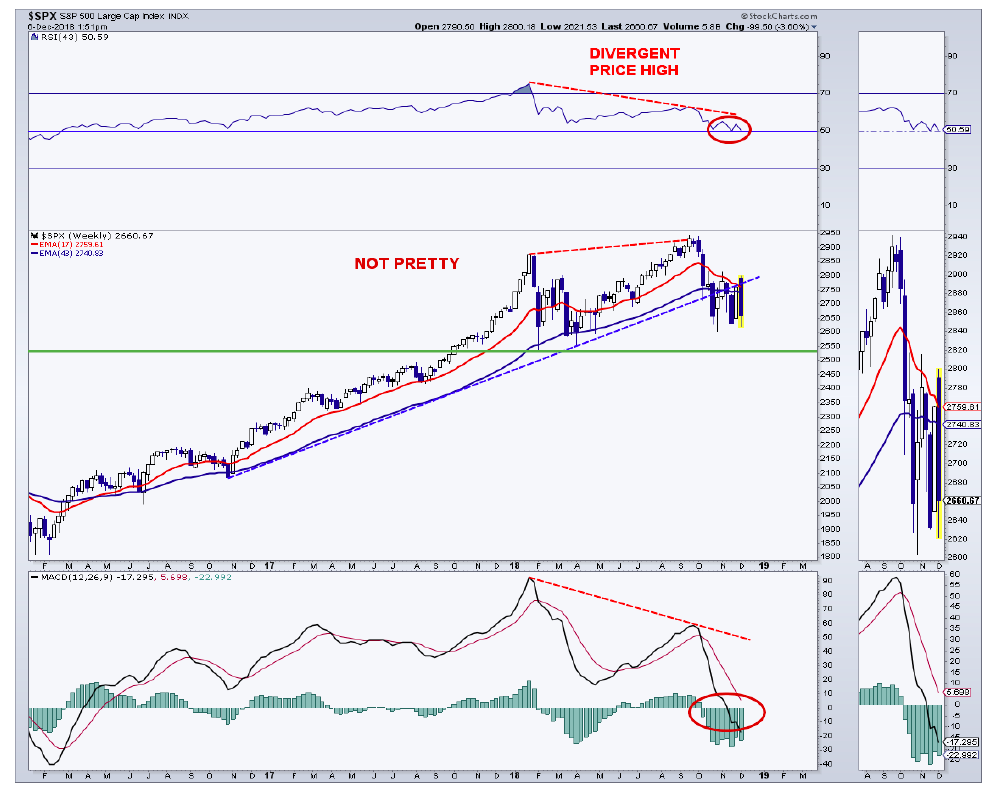
Seriously, and back to our regularly scheduled program, the bricks of the long bull market keep falling. And the foundation of the stock market is getting awfully shaky.
The S&P 500 (INDEXSP: .INX) is back toward the edge or precipice and if we don’t get another miraculous kick save, things could get quite nasty.
In some ways, the market reminds me of the 2015/2016 period, which turned into a nasty correction for the “500” and a bear market for many stocks. A stealth bear market I think I called it. There are so many studies that I have read lately, that for the most part, are at least bullish for the short- to intermediate-term. However, the failures in the studies represent bear market periods. This is what we saw in the ‘15/’16 period.
One of the major differences between now and then, is the absolute evisceration of the leading relative strength stocks (FANG and other issues) this time vs. a few years ago. Some of the leaders actually rose during the ‘15/’16 period. Leaders lead in a bull market, not get thrown into the trash heap.
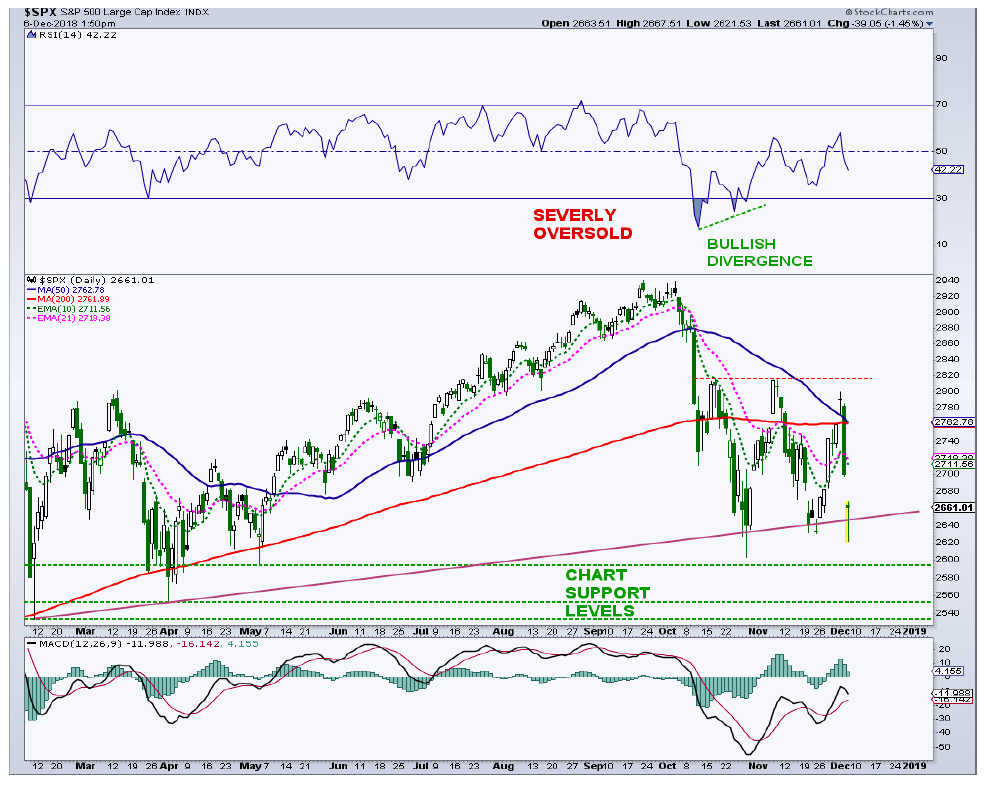
As I said last week, the stock market is in an air pocket on the daily chart. That is, there is a region or price area where there is little support or resistance. We saw this earlier in the year when the speed of moves both up and down became very high. The air pocket lies between 2,600 and 2,817. Earlier in the year, this air pocket was between 2,533 and 2,802. The rally on Monday hit 2,800 and was followed by the train wreck on Tuesday and a weak Thursday opening so we are back toward the bottom of the range or air pocket once again.
Speaking of the carnage on Tuesday, we saw some interesting data that could lead to a bounce in the short term. For instance, there was another clear washout in market breadth as the NYSE Composite had virtually zero new 52-week highs. This was recently seen near the February and April lows. It was also seen near the bottoms in ’15 and ’16.
NYSE up volume was only 26% of total NYSE volume, the weakest since the low in February. TRIN or the ARMS Index (advancing issues/declining issues / up volume/down volume) hit 2.79 on Tuesday, the most lopsided since its low in February. A high ARMS Index shows elevated (panic) selling pressure and often is close to at least a short-term (S.T.), if not intermediate-term (I.T.), low.
As far as an important positive breadth divergence, which is also seen many times at S.T./I.T. bottoms, new NYSE lows (common stock only) as a percentage of total NYSE issues traded has seen a nice decline as both the NYSE and the S&P 500 test their recent lows. At the market low on October 22, 9% of total NYSE issues were at 52-week lows. At Tuesday’s low, there were only 5% of total issues at new lows. It is very common to see positive divergences from this simple indicator at I.T. bottoms.
However, all things related to market breadth are not rosy. The percentage of stocks on the S&P 500 above their 200-day moving average has declined to 42%. Many times, the major price declines in the index occur when this reading is below 45%. Additionally, this measure fell to 35% on October 22, and over the past 10 years, I.T. bottoms occurred with readings of 14% to 27%.
Looking at a shorter-term indicator, the percentage of NYSE stocks above their 50-day average remains weak with a current reading (Dec. 4) at 32%. Any I.T. rally is likely to see this breadth gauge explode from depressed levels to 80% or 90%. The latest rally only took this measure to 50%. On the bright side, if the NYSE closes at a new corrective low today, it’s likely that we will see a pretty good positive divergence from the breath statistic as the October price low saw only 12% of NYSE issues above their 200-day average.
Overseas, the picture continues to erode from the key markets that correlate highly with the U.S. market. The German DAX (EWG), which has already broken down from a decent-sized head-and-shoulders top, is now breaking bull market trendline support off the lows since 2011. In addition, EWG has broken its 200-week average, which led to additional losses in recent years.
The iShares United Kingdom ETF (EWU) just dropped to its lowest level since April 2017 and is not far from testing its breakout area from the ‘15/’16 bottom. EWU has broken the bull market trendline off the lows since 2009 and has also busted its 200-week moving average. In the recent past, both the tops in Germany and the U.K. have coincided with major tops by the S&P 500.
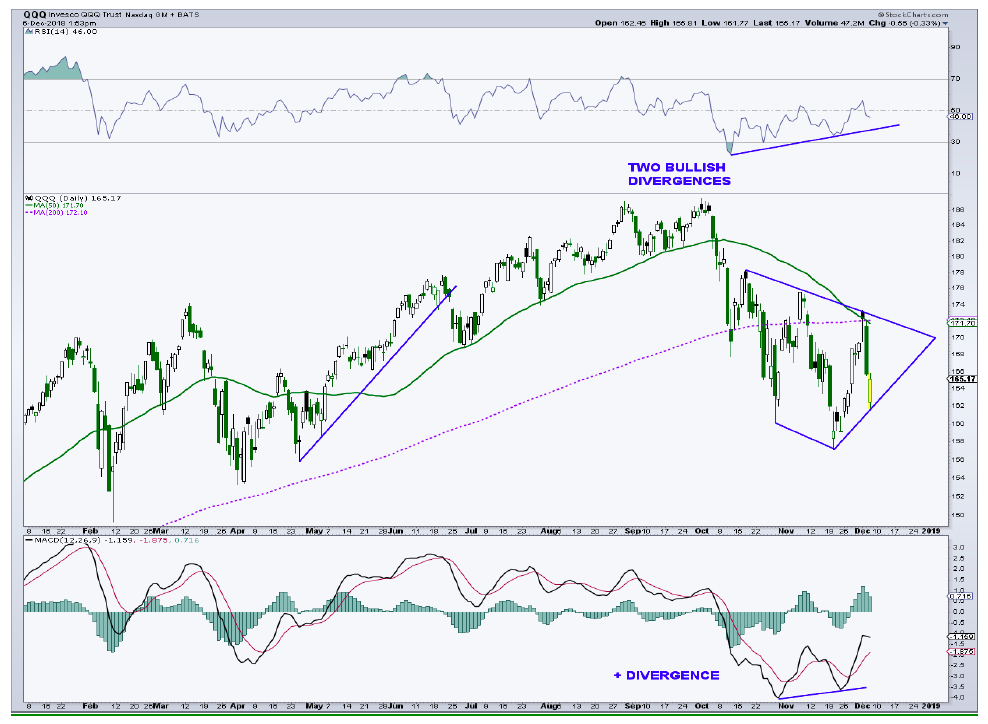
Going back to the U.S., the NASDAQ 100 (QQQ) has its own air pocket between its November low at 157 and its mid-October high at 178. Today, the QQQ’s are testing the high 150’s/low 160’s region for the third time since October 29 and are trying to turn higher form this zone once again.
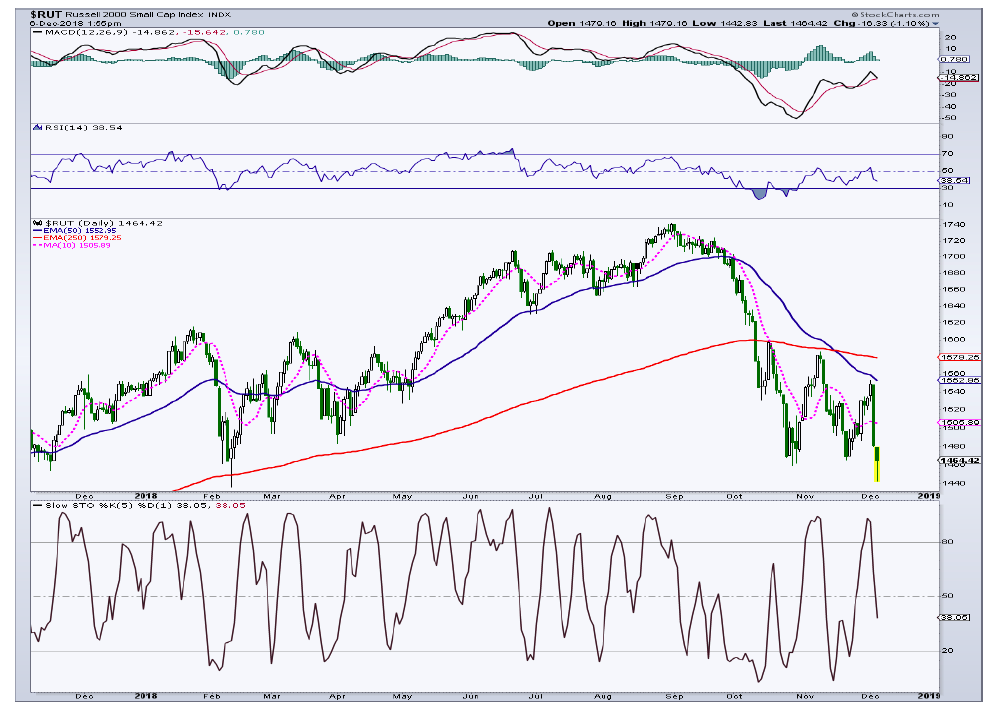
The Russell 2000 (IWM) broke to new corrective lows this morning, but is also trying to turn higher. If the ETF can muster some strength today/Friday, we will have a fairly robust bullish momentum divergence on the daily chart.
Near term, the “500” is seeing some downside capitulation signs that have led to S.T./I.T. rallies in the past. Longer term, however, clear warning signs are present. The current rally needs to be a 5-wave structure and market breadth must be very strong to prevent additional price damage.
Twitter: @MarkArbeter
The author has a long position in Platinum at the time of publication. Any opinions expressed herein are solely those of the author, and do not in any way represent the views or opinions of any other person or entity.


