With the Federal Reserve’s early announcement of a 50-bps rate cut, the financial markets had another volatile day.
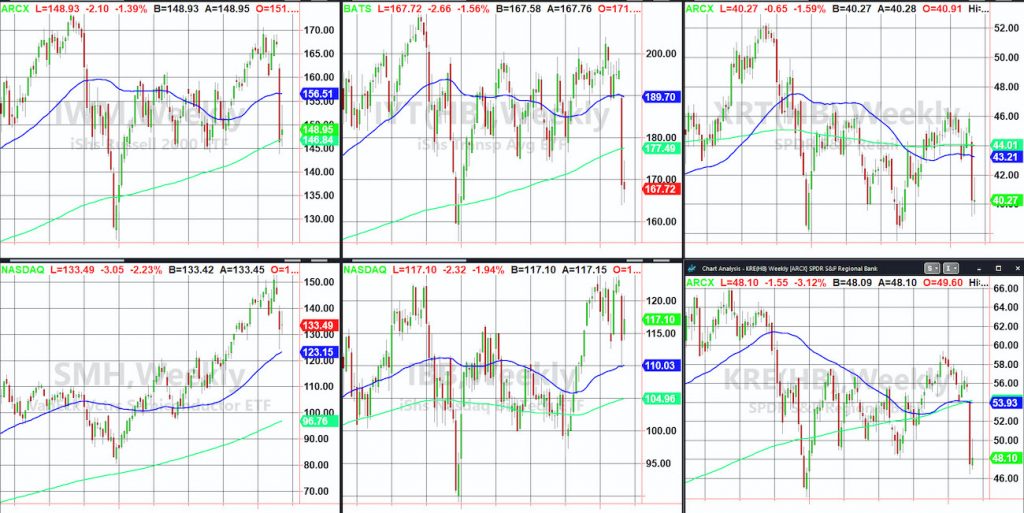
This will hardly be the first time I show you the weekly charts of the ETFs I follow – Economic Modern Family.
And, it will not be the last time.
What strikes me looking at the charts, is that every single one of the key ETFs we follow (Russell 2000 IWM, Transportation IYT, Retail XRT, Semiconductors SMH, Biotechnology IBB and Regional Banks KRE) is having an inside trading week.
Now granted, last week’s trading range as well as the volume was ginormous.
Hence, having an inside week comes as no surprise.
Nevertheless, what helps us at a time when many including myself feel a bit fatigued, is the patience we can muster up to see if the lows of last week hold or not.
Here is a list of last week’s lows for the whole Family.
Take note as these levels are not only key to hold, but also become a reasonable risk if any of these instruments can catch a bid over short-term resistance levels tomorrow.
The Russell 2000 (IWM) Low 143.91. Also important is the 200-WMA (green) as the week continues.
Transportation Sector (IYT) Low 163.89 (175 closest resistance)
Retail Sector (XRT) Low is 39.16
Semiconductors (SMH) Low is 124.31. Also note the 50-WMA (blue) just beneath at 123.15
Biotechnology Sector (IBB) Low 109.79. Like SMH, the 50-WMA sits at 110.03
Regional Banks (KRE) Low is 46.42. This is the first of the Family to enter a weekly Bear Phase.
Tomorrow Wednesday March 4th at 1 PM I am part of the very exciting webinar the called Women Teach Trading and Investing: Opportunities for Everyone in Today’s Markets
As volatility continues to soar and the markets trade like commodities did in the early 1980’s, please join my talented women trading pals and I for a “live in the market” inside view of how I use a top down approach to trading the markets in all timeframes.
S&P 500 (SPY) 304.56 the 200-day moving average resistance with 297.50 offering some support, then 285.
Russell 2000 (IWM) 146.84 is the 200-week moving average and under 144 looking at 140.
Dow Jones Industrials (DIA) 257.39 has to hold or this index ETF will see 255, then 250.
Nasdaq (QQQ) 205.50 is key price support to hold with 211.05 being resistance.
KRE (Regional Banks) This is breaking the 80-month moving average for the first time since 2012.
SMH (Semiconductors) if 132 breaks, see 128 then 124.75 – Overhead price resistance at 139.
IYT (Transportation) 162.50 is the 80-month moving average.
IBB (Biotechnology) 113 is price support and 117 is price resistance.
XRT (Retail) Awful earnings out of retail chains. If this loses 38.50 investors will have bigger troubles.
Volatility Index (VXX) Through 25, this has more.
Junk Bonds (JNK) 108.53 is price resistance with 105 being price support, then 103.50
Twitter: @marketminute
The author may have a position in the mentioned securities at the time of publication. Any opinions expressed herein are solely those of the author, and do not in any way represent the views or opinions of any other person or entity.

 Testing Important Price Support")
: Cup (and Maybe Handle) Watch")

