 The U.S. equity markets got off to a rough start in 2014 and the bears are out in full force ranting how they took the S&P 500 down 5%. I’m a little confused as to why the bears are so excited when a 5-8% stock market correction has been the typical pullback since the bottom back in 2009. But should we be worried that this happened in January? I think there is credibility to the January factor but it’s 2014 and price action will guide you in the right direction.
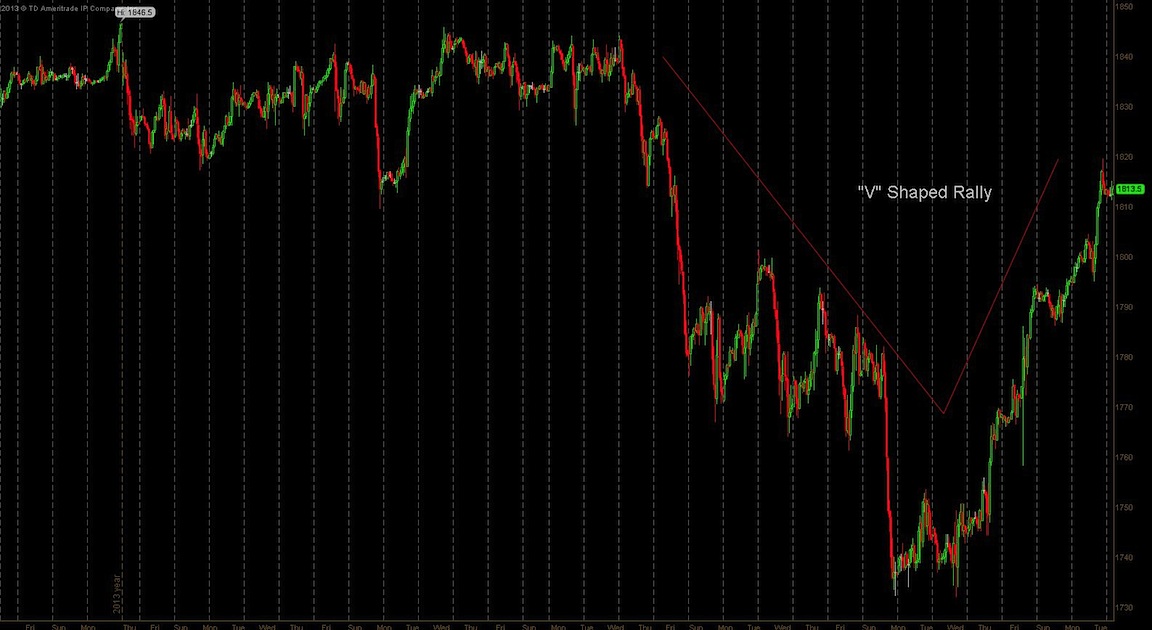
So the big question on investors our minds: “is the stock market correction really over”? The S&P 500 managed to regain the 1800 level on the futures contract a few days after it made the low at 1732. This is typically a good sign. Why? “V” shaped recoveries in equities (especially out of stock market corrections) tend to lead to further gains over the ensuing weeks.
S&P 500 Chart – V Shaped Rally
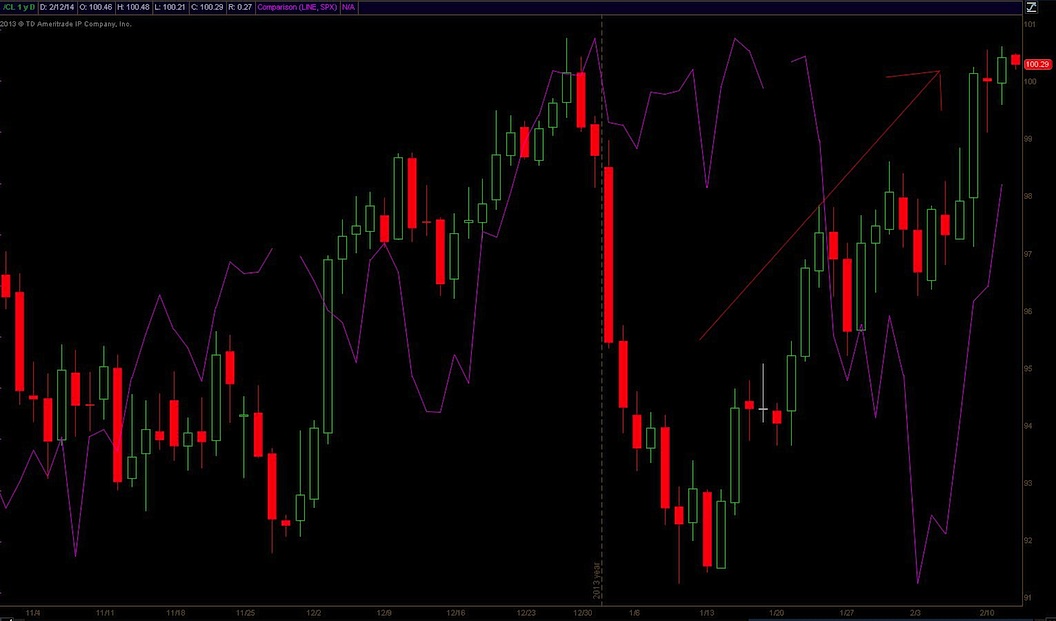
One indicator that kept me skeptical of the equities sell-off was a key divergence with Crude Oil. Oil prices completely negated the fact that the equity markets were selling off and rallied hard towards $100. If the global economy is contracting on a significant basis why would Oil prices rally? Sure, Oil prices may be rallying due to some geopolitical uncertainties overseas but I’m still in the camp that developed global markets continue to grow at a moderate pace. In fact, I believe we may see some pick up by the 3rd or 4th quarter of this year.
Crude Oil vs S&P 500 Chart
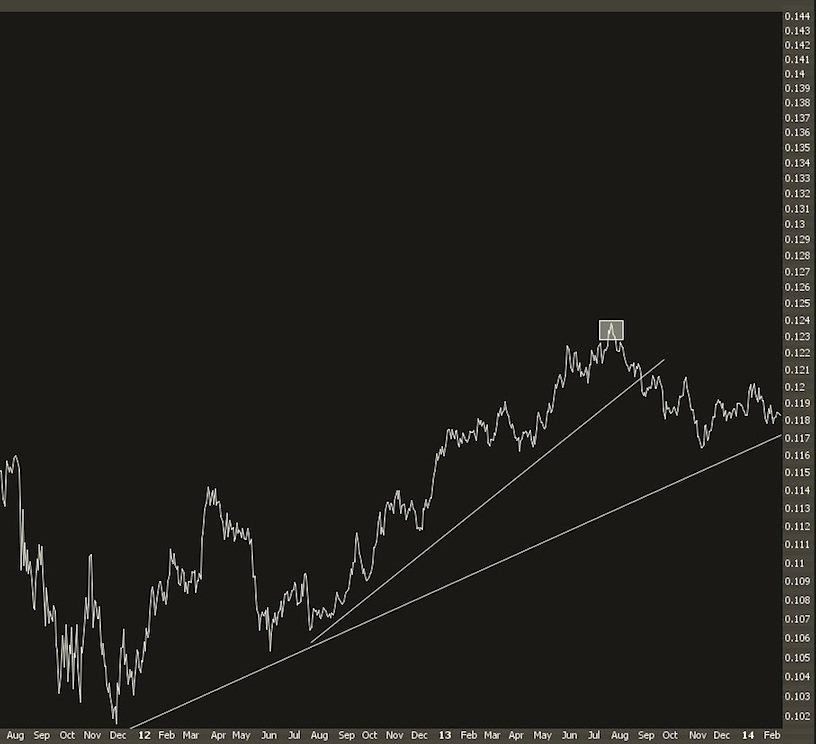
One potential concern here, though, lies within another key divergence: the relationship between the Financial Select Sector (XLF) and the S&P 500. The banks peaked last year in July on a relative basis to the S&P 500 which usually sends up a mini-warning flag. Usually banks tend to outperform on a relative basis during rallies in the market. Take a look at the chart here that shows the relative performance of banks to the S&P 500.
XLF:SPX Chart
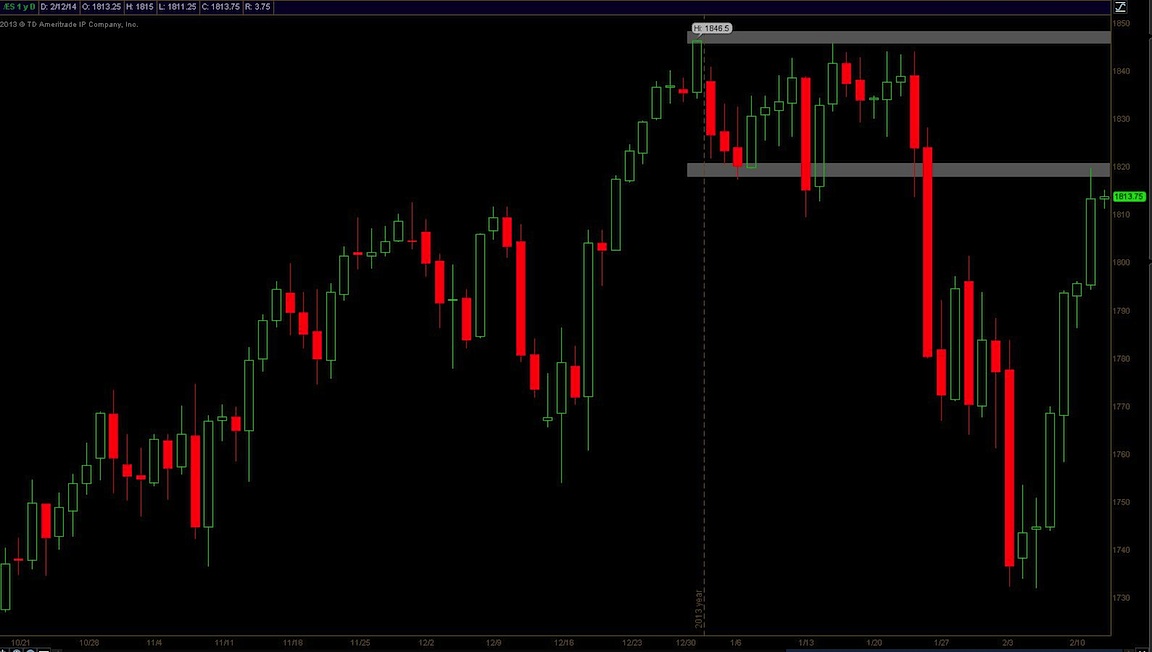
The key levels I’m watching on the S&P 500 are 1820 and 1846-1850. If we can hang around 1820 and trade sideways/consolidate the recent gains, equities should be headed back for a test of those all time highs. Again, let the price action lead.
S&P 500 Chart – Key Price Levels
Trade safe. Thanks for reading.
Charts from TD Ameritrade.
The material provided is for informational and educational purposes only and should not be construed as investment advice. All opinions expressed by the author on this site are subject to change without notice and do not constitute legal, tax or investment advice. At Castle Financial, securities are offered through Cadaret, Grant & Co., Inc. and TD Ameritrade, Inc. Members FINRA/SIPC.
No position in any of the securities mentioned at the time of publication. Any opinions expressed herein are solely those of the author, and do not in any way represent the views or opinions of any other person or entity.


