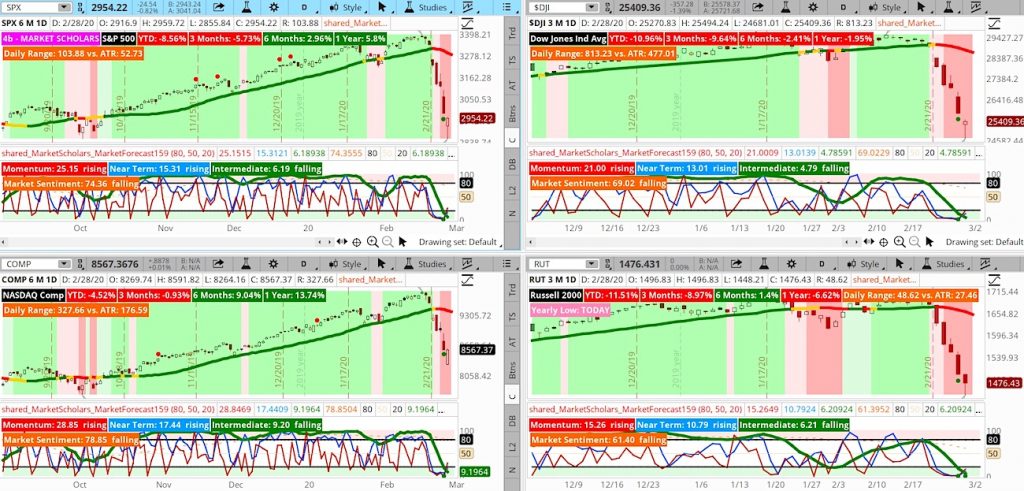
While the S&P 500 Index nearly formed a second consecutive oversold cluster and fully retraced its intermediate run from its October 2019 low, the broad market in this one week has retraced nearly 50% of its run off the Christmas Eve 2018 low.
The monthly Market Forecast chart is showing a strong bullish pattern with the momentum line just below the 20th percentile, the near-term line dropping below the chart’s midpoint with the intermediate line still easily in the upper-reversal zone.
This patterns suggests that while there may be some up-and-down volatility in the next few weeks, and there’s a good chance we end March towards the month’s highs instead of its lows.
The S&P 500 Index finished sharply below its 200-day moving average. This breakdown implies there’s a good chance we eventually form a “death cross” with the 50-day MA crossing below the 200-day MA.
This pattern does not necessarily mean we are headed for a bear market. It does suggest this pullback may take a couple of months to work out before a new intermediate trend (green line with dark green shading on the Market Forecast study) kicks off a bullish long-term run (Market Sentiment getting back above 50).
The S&P 500 closed the week more than 12% below its 30-day SMA. At this extreme low, the broad market has found strong volume support on its 1-year and 5-year Volume Profiles.
Volatility spiked this week in a move reminiscent of prior spikes in May 2010, August 2011, August 2015, January 2018 and December 2018. All these moves produced Market Sentiment pullbacks and/or “death cross” patterns. But, none of them led to bear markets or recession. And, most of the time, the market set its low point at the time of the volatility spike. This suggests that while there may be quite a bit of volatility in the next couple of months, there’s a good chance there’s only limited downside risk left.
Get market insights, stock trading ideas, and educational instruction over at the Market Scholars website.
Stock Market Video – for week of March 2, 2019
Another sign that we are not headed to recession is the strong gains in gold and long-term bonds since risk appetite peaked in October 2018. In fact, both safety asset classes are in the process of forming strong long-term bearish divergences.
Considering the frothy markets the past month or two, this selloff is setting up the potential for a really good long-term bullish rally once volatility subsides.
Twitter: @davidsettle42 and @Market_Scholars
Any opinions expressed herein are solely those of the author, and do not in any way represent the views or opinions of any other person or entity.


 Ready To Break Out?")

")

