Since we want consistency in a market and world that lacks it, we go to our reliable economic Modern Family of ETF’s.
We’ll check out the weekly charts once again to see if there are any changes and what they are telling investors.
Shortened commentary today, so let’s get right to the trading levels to watch on the charts.
S&P 500 (SPY) Inside day. The 50-DMA at 294.68 pivotal. Only gets good on a close over 298.25
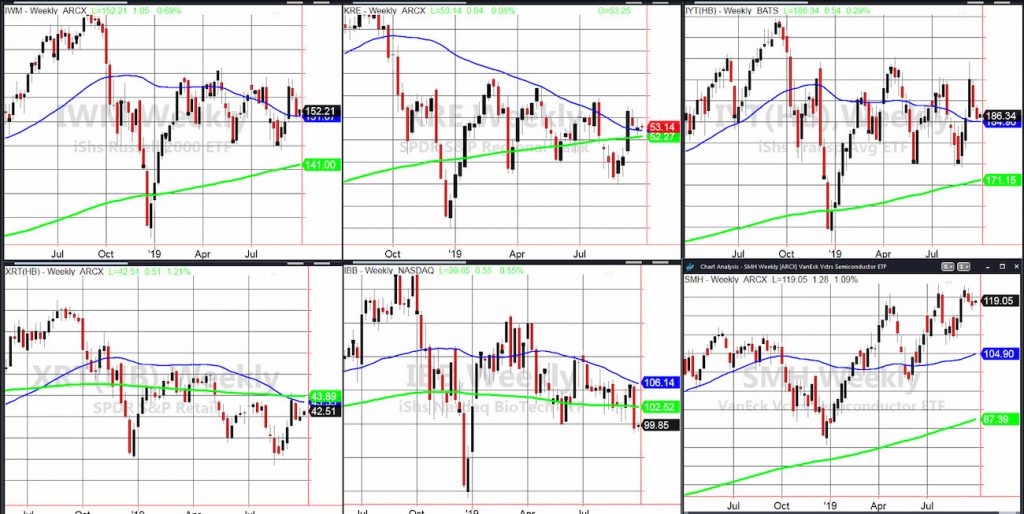
Russell 2000 (IWM) Inside day. Unconfirmed caution phase. Support at 150.50, and a move/close over the 152 would be better for the bulls.
Dow Jones Industrial Average (DIA) Inside day. Holding above the 50-DMA at 265.87. Has to clear 270 resistance.
Nasdaq (QQQ) Inside day. Confirmed caution phase with a 189 resistance, 185 minor support, and 180 underlaying support.
KRE (Regional Banks) Off the weekly charts, 52.23 to 54.00 the immediate the range to break.
SMH (Semiconductors) Inside day. 116.41 is the 50-DMA. 120 the resistance to clear.
IYT (Transportation) Inside day. Unconfirmed bullish phase and holding weekly support at 185. Through 188.45 better.
IBB (Biotechnology) Inside day. 100 pivotal, 101.28 resistance and 98.70 support to hold.
XRT (Retail) 42.40 pivotal with 43 resistance and 41.74 nearest support.
Twitter: @marketminute
The author may have a position in the mentioned securities at the time of publication. Any opinions expressed herein are solely those of the author, and do not in any way represent the views or opinions of any other person or entity.


