As a hero rides into the sunset, the screen fades to black.
In the stock market, the bears rode into the sunset with a fade to black.
Typically, an audience feels more relaxed when a scene or film ends using a fade to black.
It gives the perception of closure.
A fade to black also symbolizes a passage of time.
There is no point featuring a fade to black if the next scene takes place in the exact same timeframe as the preceding scene.

To put that in market terms, yesterday the bears showed up.
Then, with a fade to black after another round of hopeful trade talk news dominated the headlines, our bears rode off into the sunset and the bulls felt more relaxed.
If we are to assume the passage of time or that yesterday is gone and today represents a brand-new timeframe, what’s the next scene the market has in store for investors?
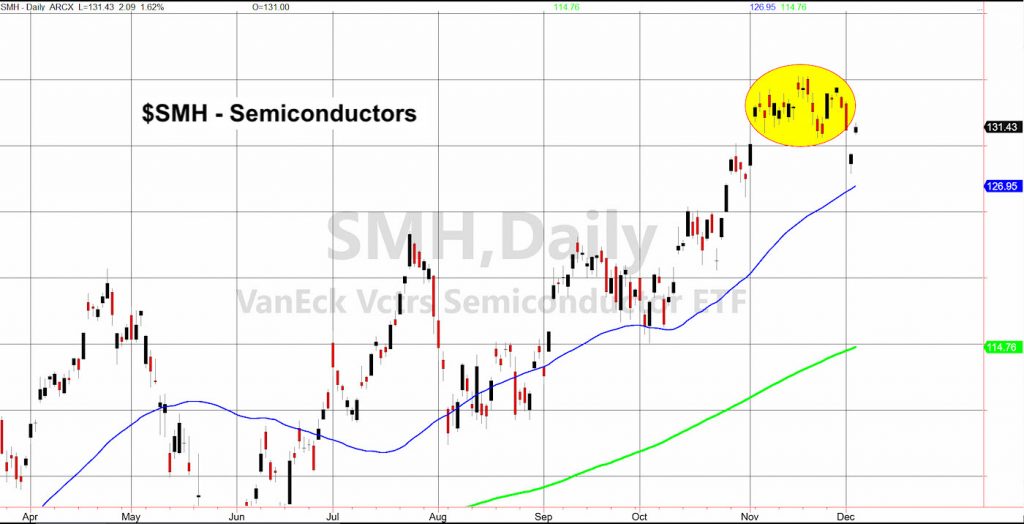
Yesterday, I illustrated a chart of the Semiconductor Sector ETF (SMH).
On November 4, SMH gapped higher and since it was a new all-time high, that made the pattern a clean breakaway gap.
Until yesterday, that gap held.
As a result, we prepared for a potential island top with the following guideline:
“If the gap to 130.60 (the low until yesterday) is not filled, then one can assume that more selling is in store.”
But with the perfect perception of closure, the bears faded to black.
In the brand-new timeframe or next scene, the bulls took center stage.
The Semiconductors ETF (SMH) opened up above 130.60 or the former gap low and closed higher at 131.24.
Does this mean we no longer worry that this movie ends with an island top?
Yes and no.
No because of the overall strength of not only SMH, but also of the overall market phases which are all bullish.
Yes because SMH retraced to the negatively sloped 10-DMA and did not clear it.
The market’s director has control. With one headline, he can change or edit the scene.
Watch for SMH to hold or fail 130.60 (the pivotal gap level).
Then, we investors will have a better idea whether it’s the bulls or the bears who next fade to black.
S&P 500 (SPY) 312 pivotal resistance 303 major support.
Russell 2000 (IWM) Best news is that this index gapped above the 10-DMA. That makes 160.35 the support to hold and a move over 162 should help the bulls.
Dow (DIA) 279.25 pivotal resistance and 272 support.
Nasdaq (QQQ) 203.25 pivotal resistance and 196 underlying support.
KRE (Regional Banks) 56.00 pivotal resistance 54.25 major support.
SMH (Semiconductors) 130.60 needs to hold with 132.10 resistance.
IYT (Transportation) 188.25 key support and if fails, will impact everything. Resistance at 193.75
IBB (Biotechnology) 116.30 key support 122.97 the 2018 high.
XRT (Retail) 44.15 resistance. 43-43.35 key support.
Twitter: @marketminute
The author may have a position in the mentioned securities at the time of publication. Any opinions expressed herein are solely those of the author, and do not in any way represent the views or opinions of any other person or entity.


