A myriad of stock market indices are hitting new highs; but is it a sure-fire bullish sign?
In Part 1 of our breakout mini-series, we discussed the importance of Wednesday’s breakout in the Value Line Geometric Composite. Our series is called Breakout “Barrage”, however, so it is appropriate to talk about the numerous stock market indices enjoying breakouts this week – so we will today.
Among the (by no means comprehensive) list of stock indices hitting new 52-week highs this week are the following:
- Value Line Composite
- S&P 500 Index (INDEXSP:.INX)
- S&P 400 Mid-Cap
- Dow Jones Industrials (INDEXDJX:.DJI)
- Nasdaq 100
- NYSE Composite
- Russell 1000
- Russell 2000 (INDEXRUSSELL:RUT)
- Russell 3000
Furthermore, not only are these indices scoring 52-week highs, they are each hitting all-time highs as well. As you know, we are big proponents of good “breadth”, i.e., lots of participation among stocks and groups of stocks within a rally. Therefore, we unequivocally consider this myriad of index new highs a positive sign for the market.
Do you sense a “but” coming? As we query in the sub-heading, does the presence of such a wide-spread group of new highs signify a “sure-fire” bullish course for the stock market. As you are likely thinking, there are no guarantees in this business. In this case, that point is driven home by at least a handful of the markers on the following chart which shows all 39 occurrences in which each of the 9 indices above closed at multi-year highs.
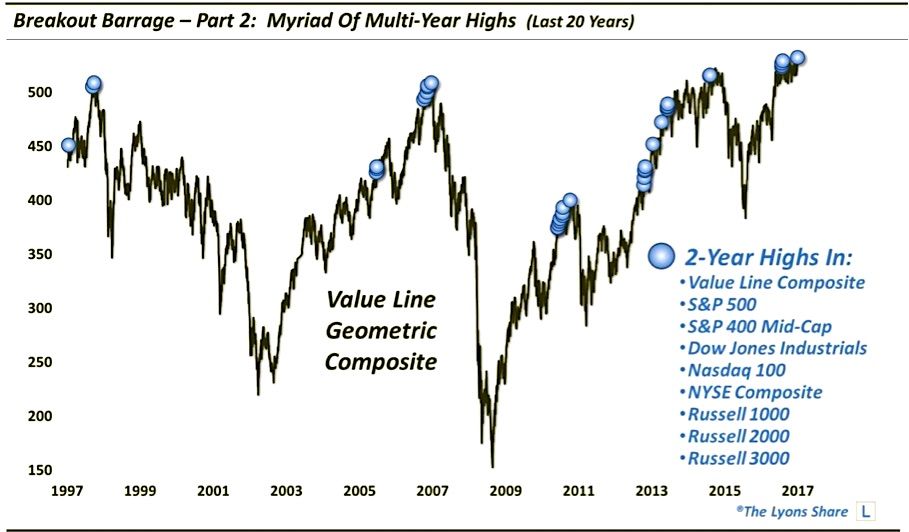
While it is often the case that sizable divergences occur at major tops in the stock market, that is not always the case – at least among the indices. As this chart proves, many key tops over the past 20 years have seen widespread new highs among the aforementioned indices. Therefore, the good breadth, or participation, at least among the indices, has not been a guarantee of further gains. In fact, over the past 20 years, future losses have been more the norm than gains.
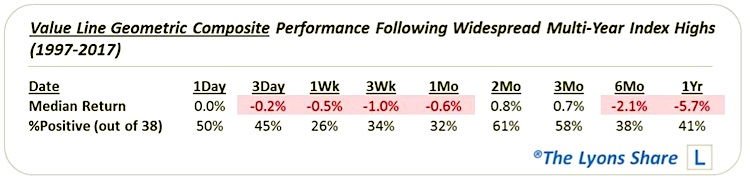
The good news is that widespread new highs do not necessarily mean a top is at hand either. Sometimes, as in 2013, the condition can persist for a long time, and still not lead up to a significant top. Plus, even when the events do lead to a top, there is usually a series of these signals prior to the final one, marking the eventual top.
Additionally, if we scroll back further to include the mid to late 1990’s, we see more evidence of a 2013-type string of positive signals. Because of that stretch, the performance data going back to 1993 is a bit rosier than just the past 20 years.
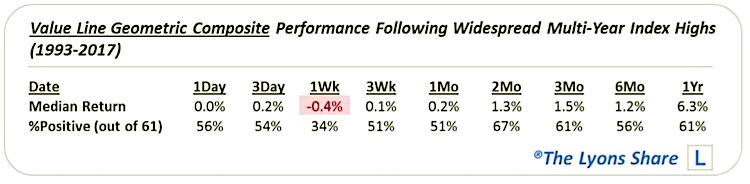
So which scenario is most likely following our present “breakout barrage”? Well, to expect another 2013, or mid-1990’s type of outcome would be to expect that stocks are embarking on a new, longer-term uptrend. That is decidedly NOT our expectation. On the other hand, we have no evidence to suggest that a major market top is imminent either. Our best guess is that this occurrence is one of those in a lead-up to some sort of a top. Incidentally, we did see a few of these incidents in February of this year as well, so this is not the first warning shot — if it is indeed a warning shot.
In summary, the wide swathe of indices hitting new highs is without a doubt a bullish sign in the immediate-term. That said, it does not guarantee extensive further gains to come. Therefore, it does not at all invalidate the considerable evidence of a potential significant top approaching in the not-too-distant future.
If you want this “all-access” version of our charts and research, I invite you to check out my new site, The Lyons Share. Thanks for reading!
Twitter: @JLyonsFundMgmt
The author may have a position in mentioned securities at the time of publication. Any opinions expressed herein are solely those of the author, and do not in any way represent the views or opinions of any other person or entity.


