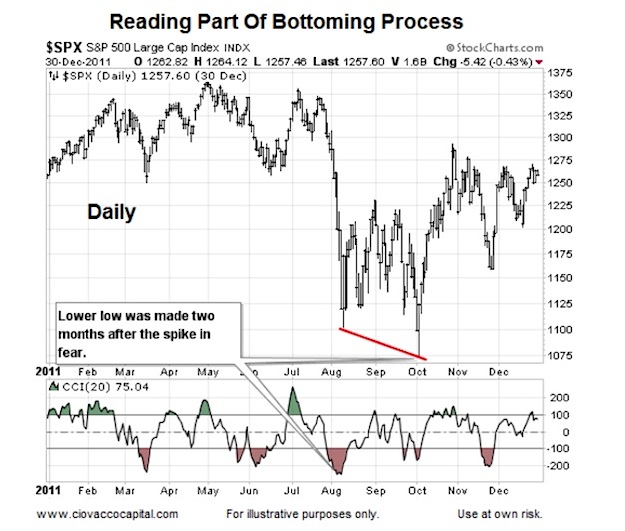
Some of the charts in this post are weekly charts, some are daily charts. To avoid confusion, you can see “Daily” or “Weekly” in the upper left corner of each chart.
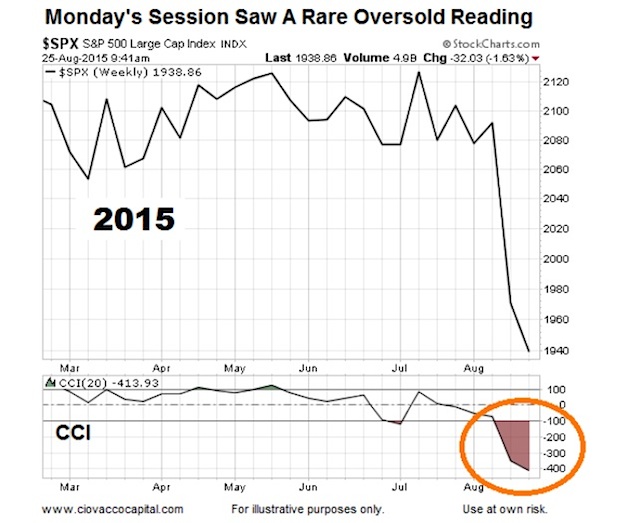
Monday Was A Rare Day
Monday’s session saw an “oversold” CCI reading of -413 on the S&P 500’s weekly chart. Going back to 1982, CCI never reached the level seen Monday. A similar weekly reading occurred only five other times since 1982; 1987, 1994, 1998, 2008, and 2011. The million dollar question is:
How can it help us?
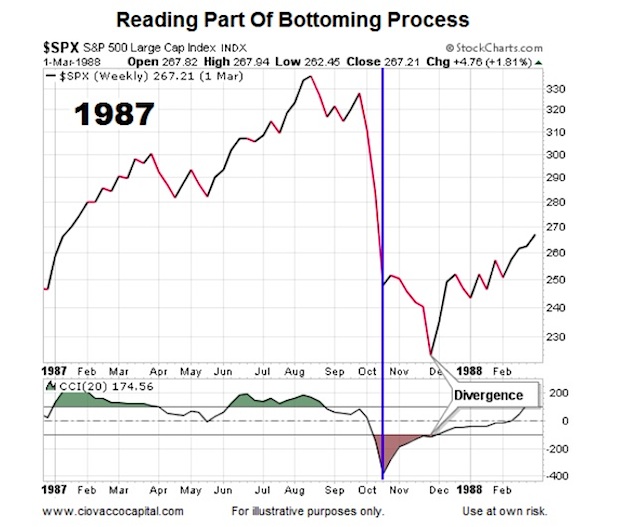
1987: Market Bottoms Tend To Be A Process
A similar weekly oversold reading came the week of the 1987 stock market crash. It is important to note, the oversold reading in CCI did not mark the bottom in stocks; it came several weeks later.
1994: Months Of Consolidation Followed
In 1994, the oversold reading did mark “the low”, but stocks went up and down and sideways for months before staging a sustained rally.
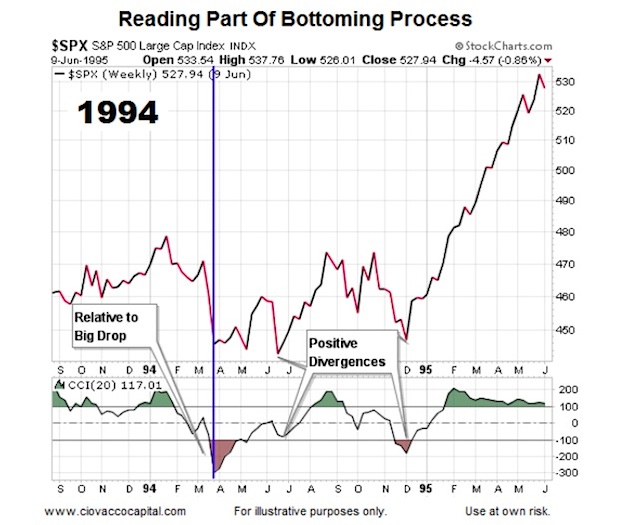
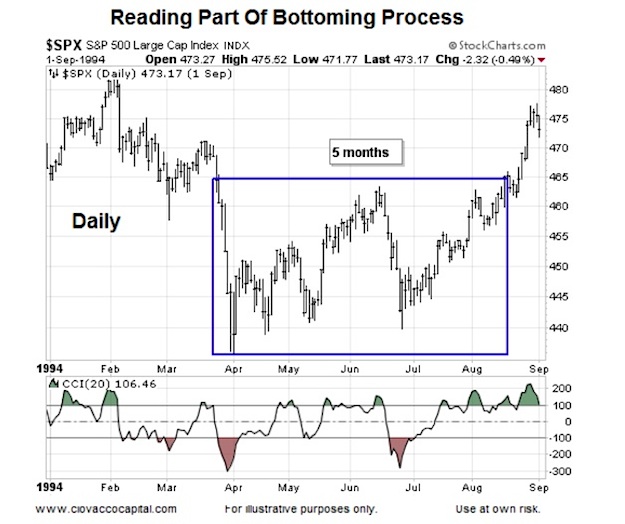
The charts above are weekly charts. The daily chart below shows the five-month consolidation period that followed the rare oversold reading on CCI and the market bottom process that unfolded.
1998: Currency and Debt Issues
CNN described the financial turmoil in 1998 this way:
That was the year Russia defaulted on its debt and devalued the ruble, creating huge losses for investors. And it didn’t stop there: the “Moscow meltdown” infected emerging markets around the globe and even caused America’s S&P 500 index to plunge about 20% between July and October of 1998.
Weekly CCI dropped below 300 in August 1998, helping signal a market bottoming process in stocks was about to begin.
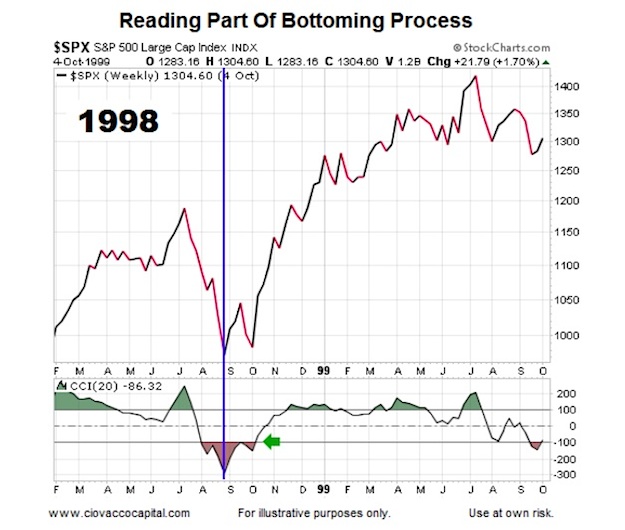
The 1998 daily chart shows that stocks made a new low after the rare oversold weekly CCI reading.

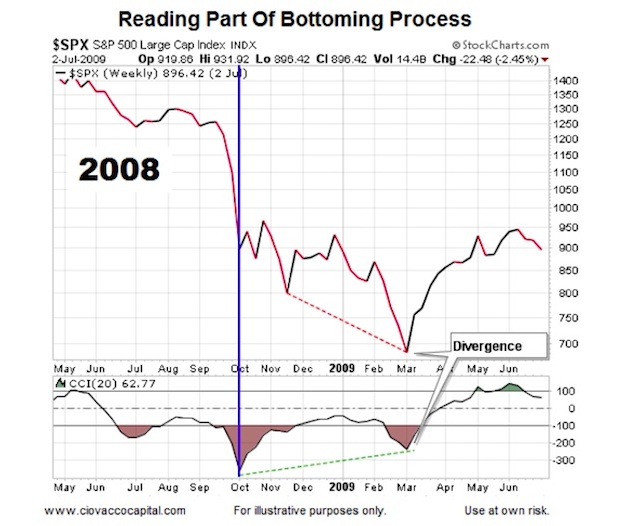
Within The Context Of A Bear Market
The other examples shown here came during bull markets. The chart below is the exception. The S&P 500 made a low of 839 when weekly CCI dropped below 300. The stock market did not bottom until hitting an intraday low of 666 in March 2009.
Most Similar To 2015?
2011 featured a multi-month consolidation followed by a waterfall plunge in stocks – sound familiar? CCI hit its lowest reading in August 2011.
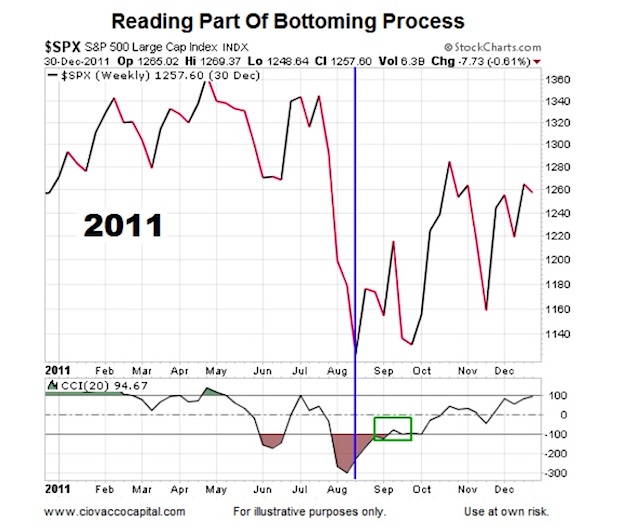
The daily chart below shows CCI helped mark a market bottoming process, but stocks did not bottom until early October 2011.
Moral Of The Story
Rather than telling us to mortgage the house and max out our margin account to load up on stocks, the rare and low weekly reading in CCI told us in the past and tells us today to remain open to either (a) a market bottom or (b) a bottoming process that could take weeks or months. In all the historical cases above, stocks made a low within days or months.
Thanks for reading.
Twitter: @CiovaccoCapital.
Any opinions expressed herein are solely those of the author, and do not in any way represent the views or opinions of any other person or entity.


")
 Rolling Over At Key Fibonacci Level?")


")