Whether you’re a new trader (or just new to day trading) the first thing that becomes clear is that the market doesn’t just go in a straight line from point A to point B, it moves in waves, or stair steps it’s way up and down. Today we have a couple long trades setup that I would like to walk you through.
Using a simple Fibonacci Retracement tool you can find low risk entry points simply entering at the 50% on a pullback. The key however, is waiting for a break in swing highs before entering into a long (and a break of swing lows before entering into a short).
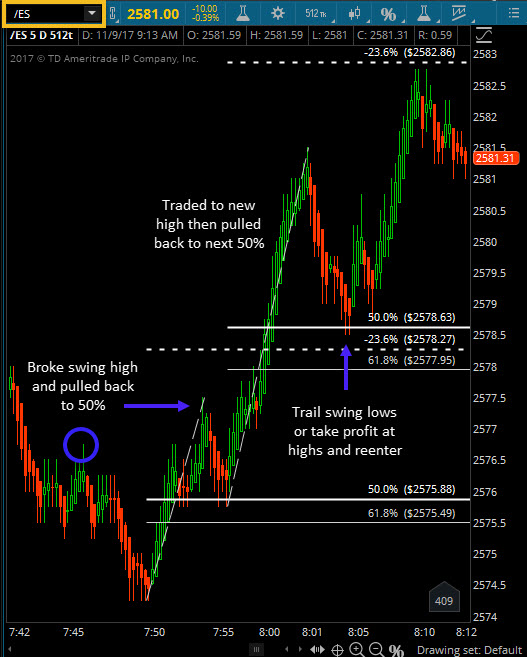
In the attached E-mini S&P chart from today (Thursday Nov 9th) we see the market come off lows of the morning and break its swing high. This is the first indication that we could be changing trend. See below.
From that break of swing highs, I will draw my Fib retracement from lows to those highs and enter on a pullback to the 50%. Trade management is simple, trail swing lows on the way up, or exit at the -23% target.
The best part is, this process can be repeated all day long, on any market or timeframe! For more information on how I trade these setups each day visit EminiMind.com, my specific trading rules are all outlined there.
ALSO READ: 3 Golden Nuggets of Wisdom For New Traders
S&P E-Mini Futures Chart – Morning of November 9
Thanks for reading.
Twitter: @EminiMind
Any opinions expressed herein are solely those of the author, and do not in any way represent the views or opinions of any other person or entity.


