In the past week, there have been some warning signs for the stock market, but just in the short term.
Longer-term, other than reaching some measured move price targets, potential fifth wave completions, and some frothy sentiment numbers, I still am fighting that we are near the end of the bull market.
We continue to see some odd price machinations, and I guess some of them are at least partially attributed to the time of year. Summer (July and especially August) tends to be vacation time on Wall Street, and other parts of the country, so trading volumes disappear and in some years, volatility diminishes.
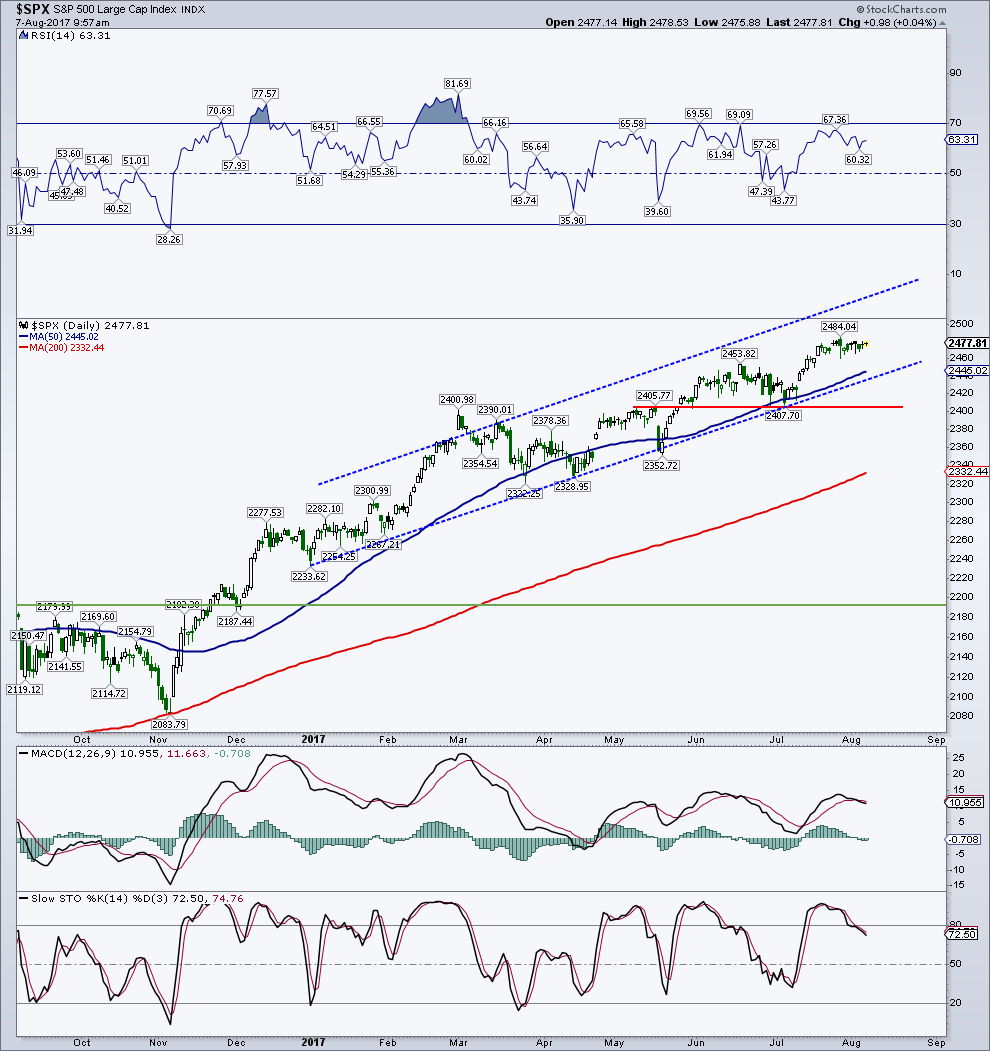
In the past 13 days, the S&P 500’s (INDEXSP:.INX) closing high was 2,477.83 and its closing low was 2,469.91 for a whopping 8 point spread or about 0.3%. A 5 or 10-point intraday move seems like its newsworthy. Surprising as it may sound, we’ve seen a lot of this price action this year – in fact every single month.
S&P 500 Chart
At the same time, the Dow Jones Industrial Average (INDEXDJX:.DJI) is working on its 10th straight gain today. Most of you know how I “love” this index and tend to ignore writing about it based on its absolute price weighting. A big part of the DJIA’s recent gain comes from one stock, Boeing (BA). When should any index, let alone one that is followed by the World, be led by one stock? Never! BA is now the highest priced stock in the DJIA and therefore, carries the most weight in the index.
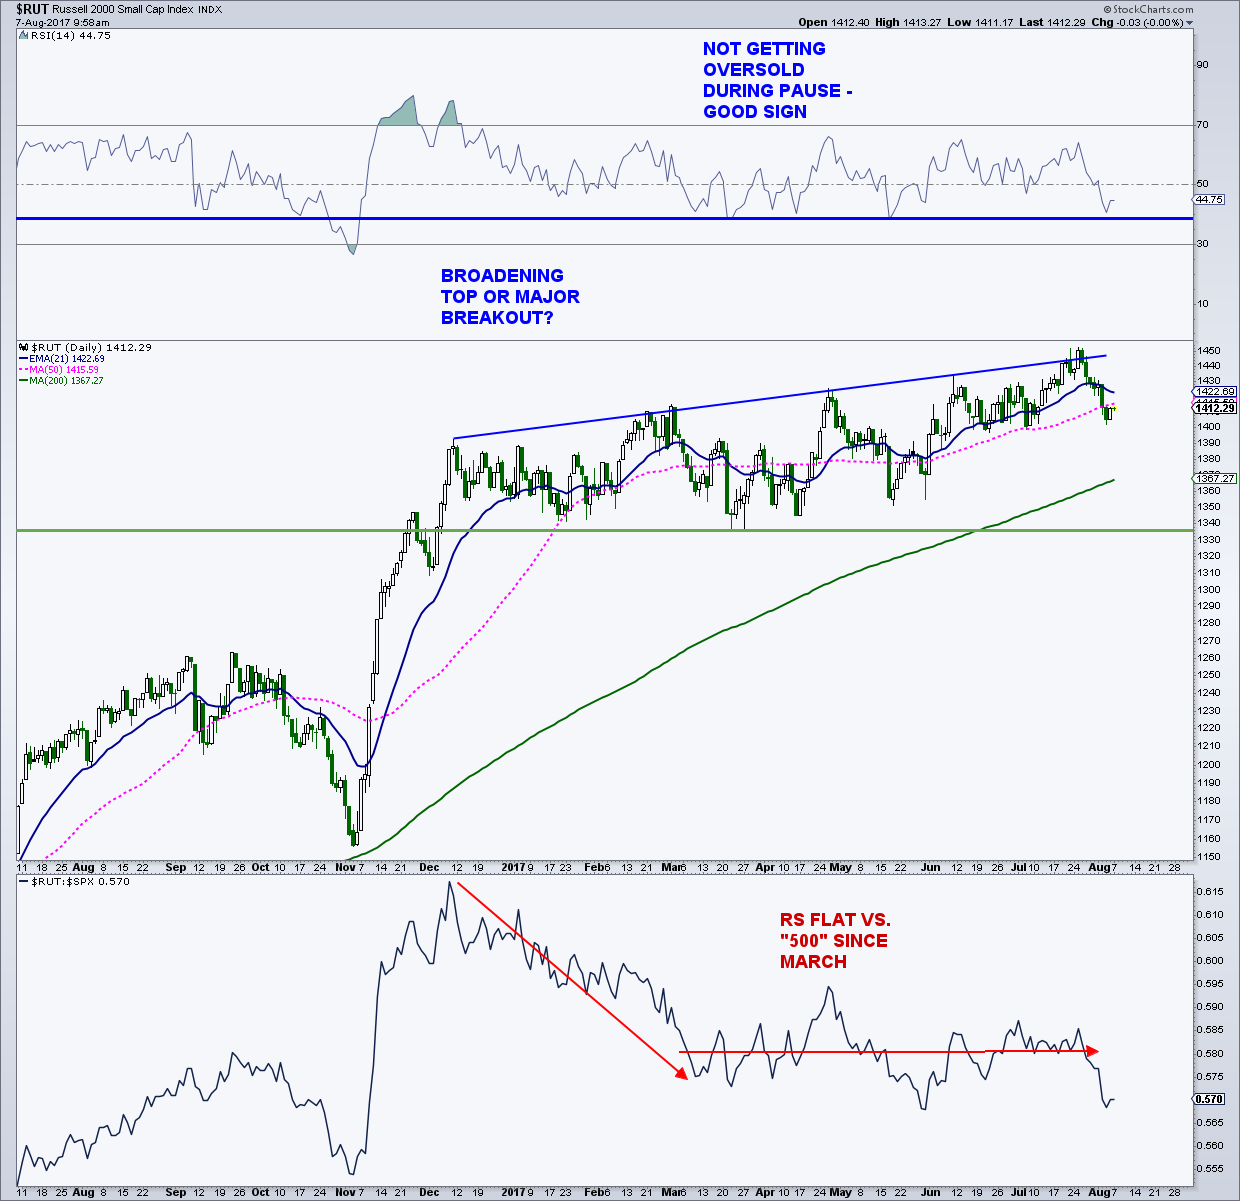
And once again, at the same time, the Russell 2000 (INDEXRUSSELL:RUT) has been struggling – it was down 6 out of 8 sessions through Friday. The S&P 500 is as flat as a pancake, the DJIA is running above 22,000, and the Russell 2000 is seeing a failed breakout to new all-time-highs and falling just below its 50-day moving average.
Russell 2000 Chart
When you combine some of these performances, you get the potential for some trouble in the near term. When the Dow Jones Industrials closes at a 52-week high and the Russell 2000 closes below its 50-day average, market performance has not been great, according to www.sentimentrader.com. Over the next 2 weeks, the S&P 500’s mean return was -1.4% with 4 winning periods and 10 losing periods.
For the Russell 2000, it was worse. The mean return over the next 2 weeks was -2.4% with 2 winning periods and 12 losing periods out of 14 occurrences. Looking out 6 months to a year for both indices, returns were about average.
ALSO READ: 3 Charts Signaling Near-Term Caution
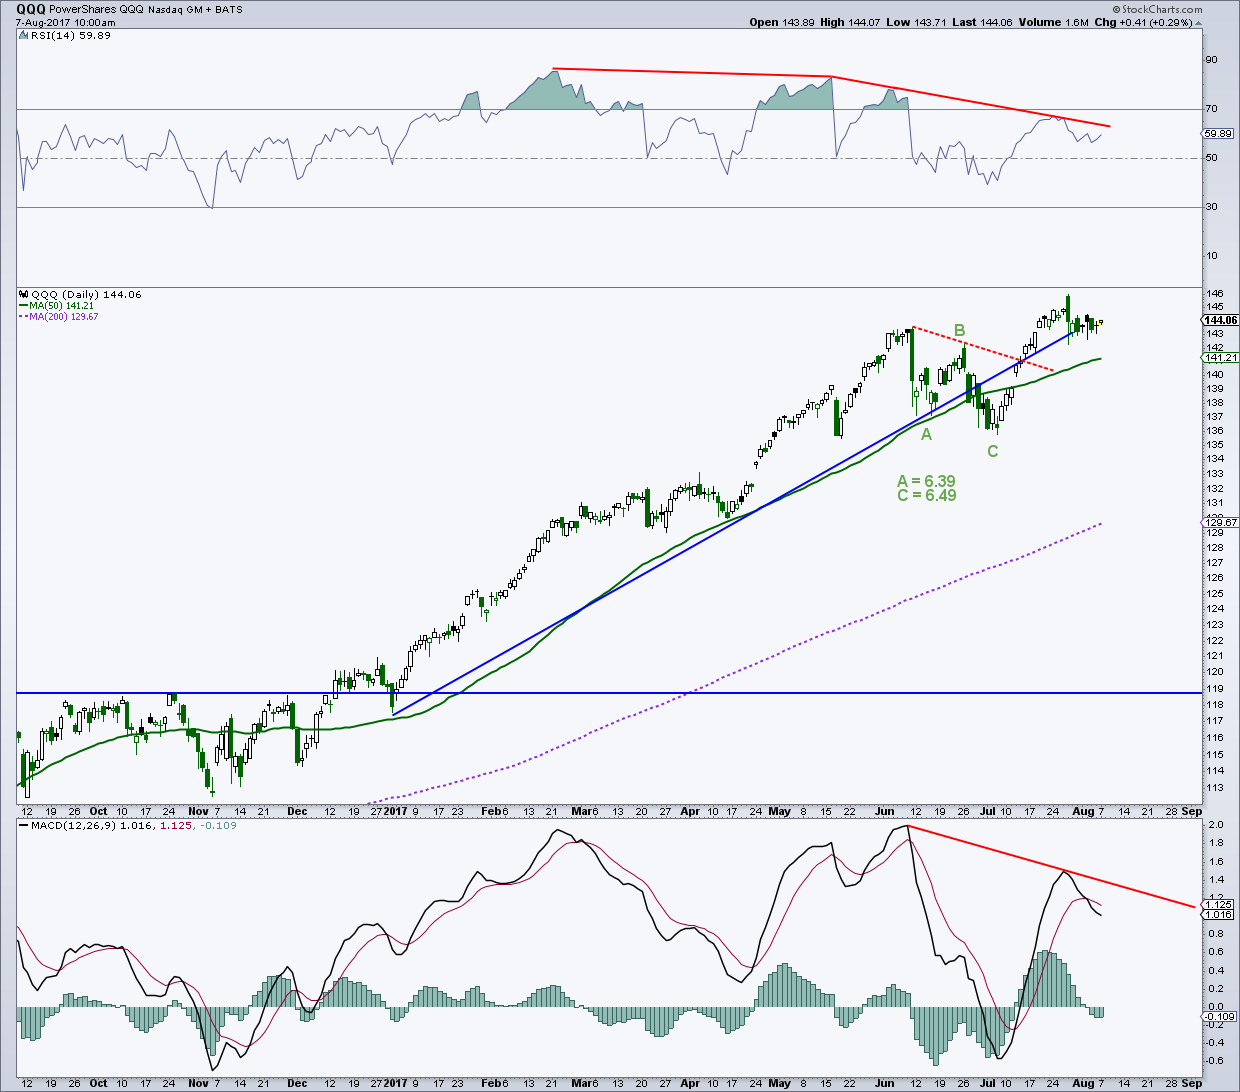
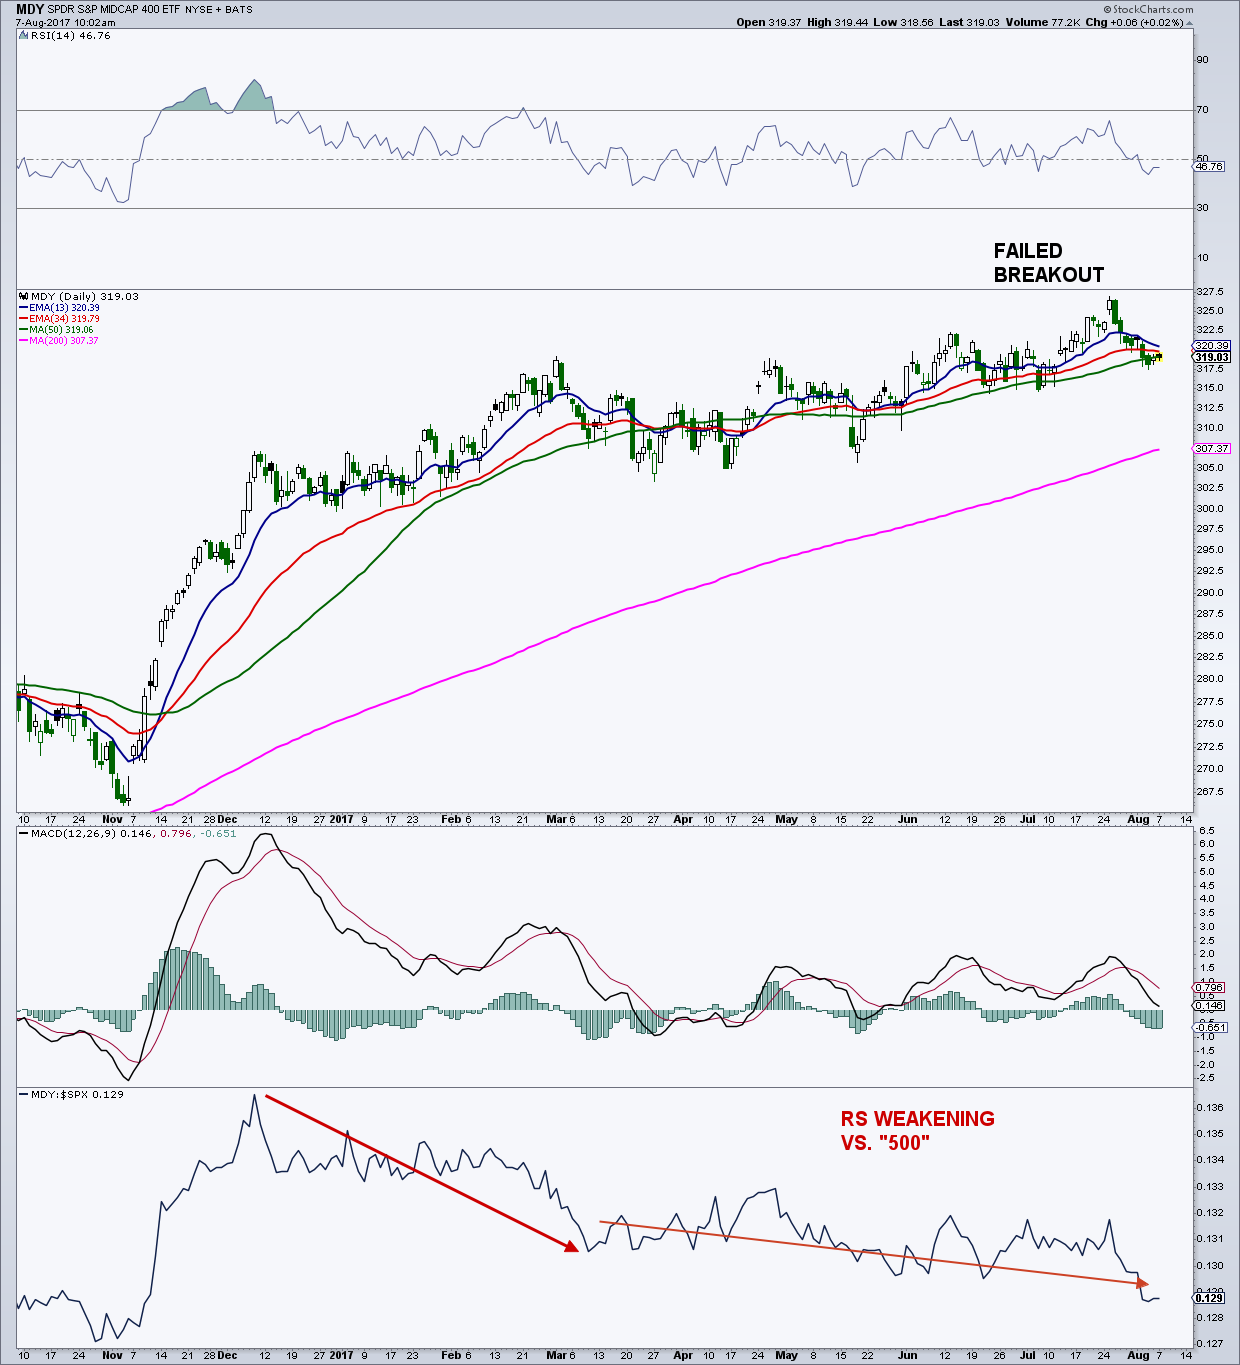
In an email update to subscribers on August 1, I talked about the disappointing price action of the Russell 2000 and S&P MidCap 400 as well as potential trouble for the PowerShares QQQ Nasdaq 100 ETF (NASDAQ:QQQ). Since then, the “2000” is down almost 1% (WOW in this market) with the MidCap down slightly and the QQQ’s are flat.
Nasdaq 100 ETF (QQQ) and S&P MidCap 400 ETF (MDY) Charts
I have been wrong on the Russell 2000 a couple of times this year. Early in the year, I thought the index would give back more of its big gains seen at the end of 2016. The “2000” did pause, but never did break down from a very large sideways base. Just recently, the index broke to new highs along with the Mid Caps, and I thought that a big move higher was finally here after 6+ months of nothing. Nope! The “2000’s” breakout failed and now is just under its 50-day, back in the big ole base.
All in all, the recent underperformance and failed breakouts by the small and mid caps are disappointing in the short term, and may suggest some weakening in the overall market is coming in the near term.
Over in sentiment land, more specifically the options world, there are some market warnings from a couple of our favorite indicators. The 5-day equity only put/call (p/c) ratio fell to 0.57 during the latter part of July, close to its low for the year. The 3 prior times the p/c got this low this year, the “500” pulled back about 1 – 2%. During 2016, when the market was more volatile, the pullbacks were greater.
The 21-day equity-only p/c ratio is sitting at 0.63, well above the major warning levels we’ve witnessed in the past. For instance, this p/c fell to 0.50 in July 2014, 0.50 in December 2010, and 0.47 in April 2010. All these very bullish p/c ratios (that is heavy call buying vs. put buying) eventually led to major pullbacks. Two of them marked periods of trend change for the 21-day from down to up. This is very important because as long as p/c’s are falling during a bull market, it is bullish for stocks. Turns in the p/c to a higher trend tend to lead market tops, sometimes by many months.
The 10-day OEX p/c ratio, which is a smart money indicator, has just issued a minor warning for stocks for the first time since early May. The ratio slightly exceeded the 1.70 level, indicating that the smart money was buying puts more heavily than calls. When the smart money is bearish, you follow them.
We have only had 2 warnings from this p/c ratio this year and both preceded 1 to 2% declines for the “500.”
Conclusion: In the near term, I’m a little cautious on the stock market, but I still see 2,500+ sometime later this year for the S&P 500.
Feel free to reach out to me at arbetermark@gmail.com for inquiries about my newsletter “On The Mark”. Thanks for reading.
Twitter: @MarkArbeter
The author may have positions in related securities at the time of publication. Any opinions expressed herein are solely those of the author, and do not in any way represent the views or opinions of any other person or entity.


 Ready To Break Out?")


 Rolling Over At Key Fibonacci Level?")
